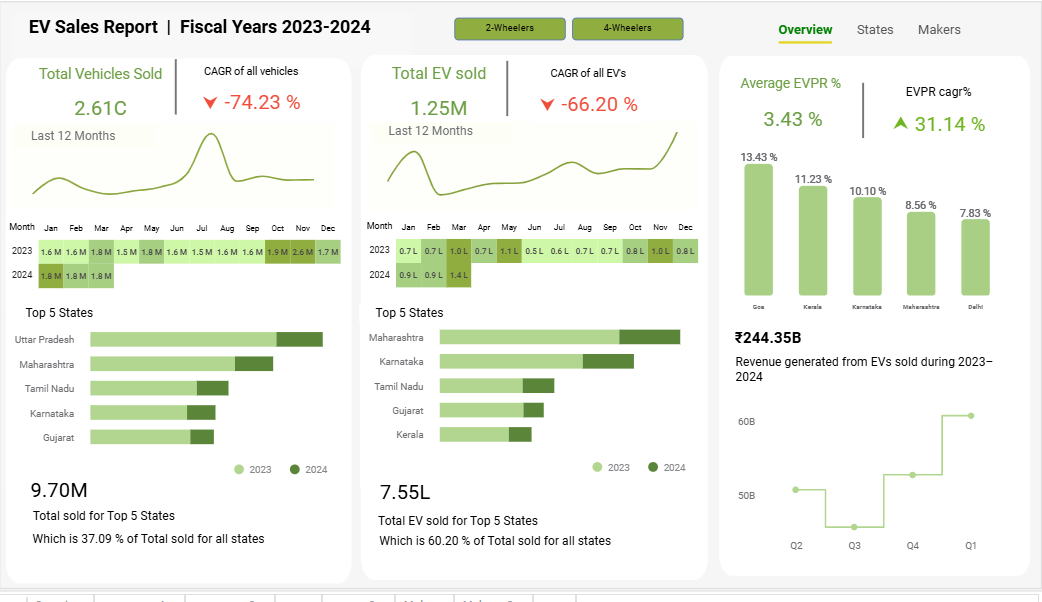
From Numbers to Insights, EV Sales Intelligence Dashboard is Live!
Electric Vehicles are not just a trend anymore… they are reshaping mobility
in India.
So instead of looking at static reports, we built something
decision-makers can actually use.
We’re excited to share our EV Sales Analytics Dashboard (FY
2023–2024) designed to convert raw registration data into clear,
business-ready insights.
What you can explore inside the dashboard?
Market Overview
Total vehicles sold vs total EV adoption
EV Penetration Rate (EVPR) trends
Quarterly revenue movement from EV sales
Month-wise performance patterns (spot seasonality
instantly)
State Intelligence
State-wise sales performance
Growth & de-growth (CAGR comparison with last year)
EV penetration across regions
Identify which states are adoption leaders vs
opportunity markets
Maker Performance
Brand-wise market share
Year-over-year growth comparison
Fastest growing vs declining manufacturers
Competitive benchmarking in seconds
Vehicle Segments
2-Wheelers vs 4-Wheelers adoption comparison
Segment-wise EV penetration
Market shift visibility
Why this matters
Businesses often track sales…
But decisions require patterns.
This dashboard helps you answer questions like:
Where should we expand next?
Which state is ready for EV infrastructure?
Which OEM is gaining momentum?
Is the market growing or just shifting?
Instead of opening multiple Excel files, you can now understand the entire
EV ecosystem in one screen.
We didn’t just build a dashboard.
We built a decision support tool for the EV market.
Curious to see it in action?