Axis
Here, the word 'Axis' refers to the X-axis. The figure below shows the various fields present in the Axis formatting in the X-axis.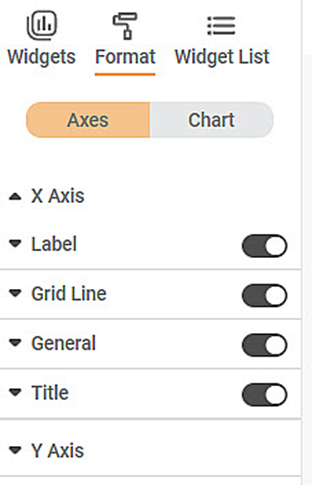
The table given below describes different fields available for Axis formatting for X-axis.
Field | Description | Remark |
|---|---|---|
Width | It allows you to select the width of the line that represents the X-axis. | The default width selected is zero. |
Color | It allows you to select the color of the line that represents the X-axis. | — |
Minimum Column/Bar Width | It allows you to increase or decrease the width of the columns or bars in a widget. | It applies to all types of bar and column charts. |
To use Axis formatting options, first plot a Column Chart using the dimensions and measures from the dataset. For example, we plot a Column Chart of the Count of Cards against Gender. The Ethnicity of the sample is the Legend dimension.
The figure given below shows an original image of the Column Chart. By default, the axis width is zero (0).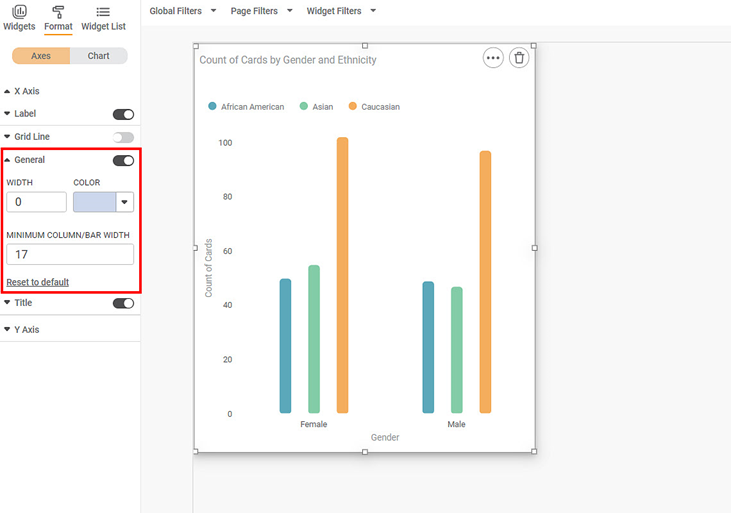
Now, change the
- width and color of the X-axis
- width of the columns
The resultant widget is shown below.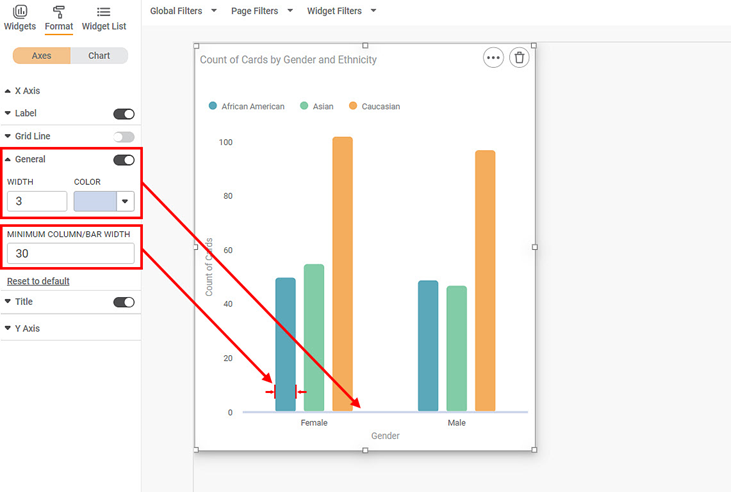
Notes: | You can customize the color of the axis by clicking Custom in the color drop-down.
You can also adjust the Hue, Saturation, and Lightness of the selected color to change its appearance.
|
Related Articles
Axis Title ( Y-axis)
Axis title is the heading that you want to give to the Y-axis. The table given below describes different fields present on Axis Title formatting in Y-axis. Field Description Remark Text It allows you to give a suitable title to the axis. Axis title ...Axis Label (Y-axis)
Axis Label is the parameter that represents the variable plotted on the Y-axis. The table given below describes different fields present on Axis Label formatting in Y-axis. Field Description Remark Text It allows you to modify the parameters of the ...Axis Title
The Axis title is the heading that you want to give to the X-axis. The table given below describes different fields present on Axis Title formatting in X-axis. Field Description Remark Text It allows you to give a suitable title to the axis. Axis ...Axis Label
This formatting option allows you to make the following changes to the Axis Label. You can change the text font and also its size and color. You can make the text bold, italic, and underline it. Axis Label is the parameter that represents the ...Color Axis
The Color Axis formatting option is available for Map chart. The table given below describes different fields present for Color Axis formatting. Field Description Remark Min Color It allows you to change the color of the Minimum value on the Map ...