Box Cox Transformation
Box-Cox Transformation is located under Model Studio > Statistical Analysis > Box Cox Transformation. Alternatively, use the search bar to find the Box-Cox Transformation test feature. Use the drag-and-drop method or double-click to use the algorithm in the canvas. Click the algorithm to view and select different properties for analysis.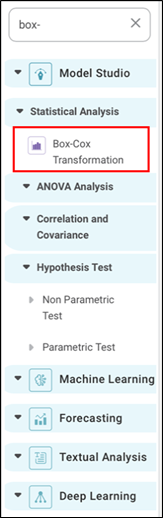
Properties of Box-Cox Transformation
The Box-Cox Transformation's available properties are shown in the figure below.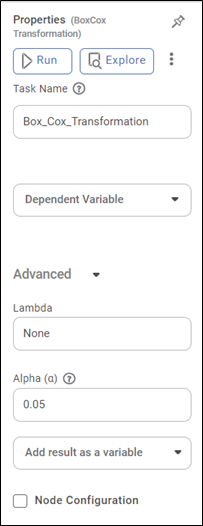
The following table describes the properties of box-cox transformation.
Field | Description | Remark |
Run | It allows you to run the node. | - |
Explore | It allows you to explore the successfully executed node. | - |
Vertical Ellipses | The available options are · Run till node · Run from node · Publish as a model · Publish code | - |
Task Name | It is the name of the task selected on the workbook canvas. | You can click the text field to edit or modify the task name as required. |
Dependent Variables | It allows you to select the Dependent variable | You can choose only one variable, which should be Categorical.
|
Lambda | It is a parameter that determines the type and magnitude of the transformation applied to the data. | The default value is none. |
Alpha | It refers to the transformation parameter lambda, which determines the type and extent of transformation applied to the data. | The default value is 0.05 |
Example of Box-Cox Transformation
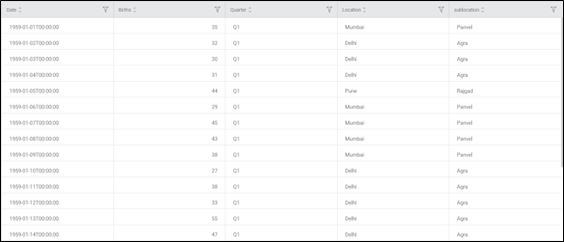
We consider the FemaleBirth Dataset. A snippet of input data is shown below.
The Result page of Box-Cox transformation is shown below.
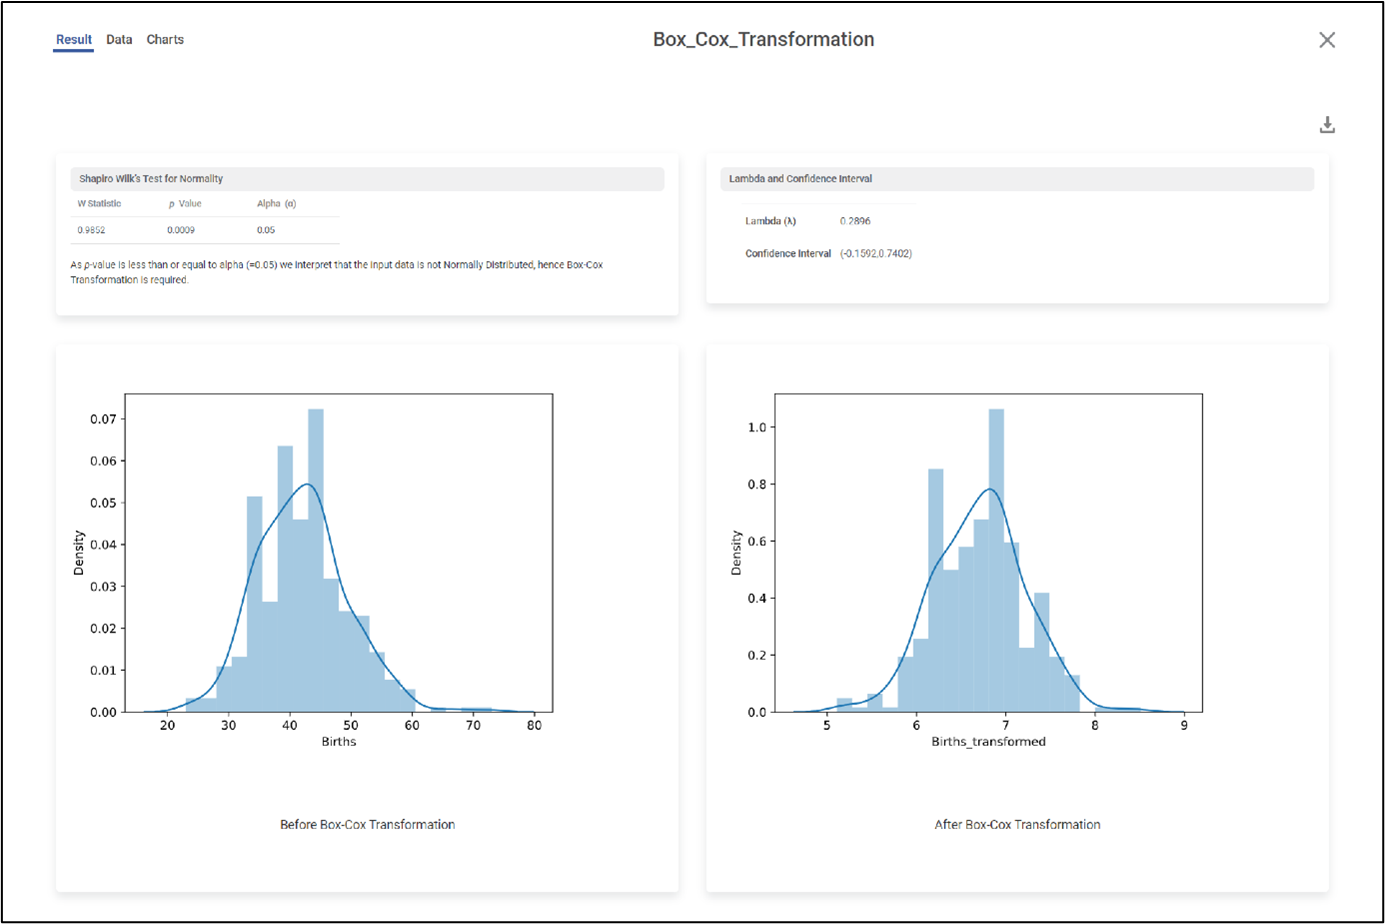
The result page displays the following sections
- Shapiro Wilk's Test for Normality: - It is a statistical test used to assess the normality of a data sample.
It shows the W statistics, p-value, and alpha value. Also, Depending on the p-value it shows the inference about the distribution of data.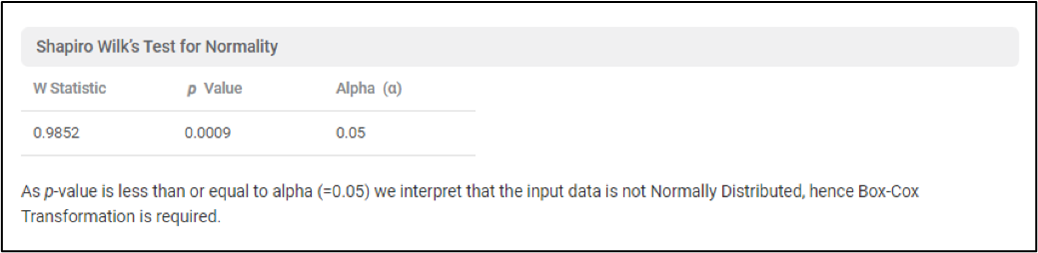
- Lambda and Confidence Interval: - It determines the type and extent of transformation applied to the data.
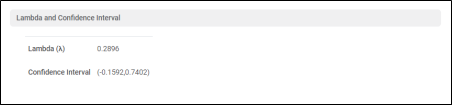
- The above image shows Lambda values and confidence intervals. This lambda value converts the distribution of data into a normal distribution.
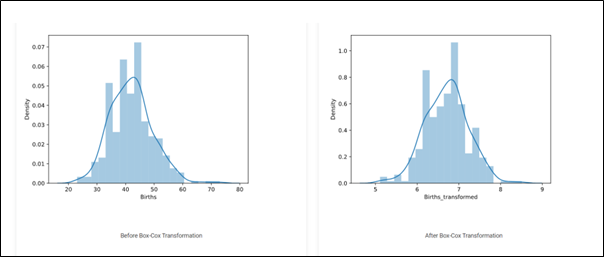
The above graphs show the distribution before and after the application of Box-Cox transformation. It is clearly seen the that data is more normally distributed after the application of Box-cox transformation.
Related Articles
Johnson Transformation
Johnson transformation is located under Model Studio > Statistical Analysis > Johnson Transformation. on the left task pane. Use the drag-and-drop method (or double-click on the node) to use the algorithm in the canvas. Click the algorithm to view ...Holt Exponential Smoothing
Holt Exponential Smoothing is located under Forecasting > Modeling > Holt Exponential Smoothing. Double-click or drag-and-drop the algorithm to use in the workbook canvas. Click the algorithm to view and select the different properties for analysis. ...Holts-Winters Exponential Smoothing
Holts-Winter Exponential Smoothing is located under Forecasting > Modeling > Holts-Winter Exponential Smoothing. Double-click or drag-and-drop the algorithm to use in the workbook canvas. Click the algorithm to view and select the different ...Components in Forecasting
Forecasting deals with the analysis and detection of trends in the time-series data. The components of forecasting are, Data Exploration: Data Exploration is used to explore the time-series data. It helps in identifying the underlying parameters ...Data Preparation
Time-series Data Preparation organizes and formats transactional data into time-series data to predict trends and seasonality in the data. Transactional data is timestamped data recorded over a period at no specific frequency, while time-series data ...