Color Axis
The Color Axis formatting option is available for Map chart.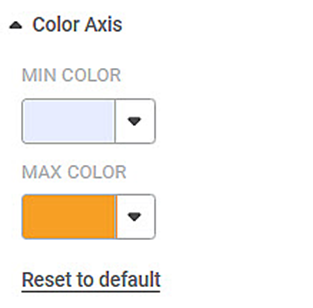
The table given below describes different fields present for Color Axis formatting.
Field | Description | Remark |
|---|---|---|
Min Color | It allows you to change the color of the Minimum value on the Map chart. | — |
Max Color | It allows you to change the color of the Maximum value on the Map chart. | — |
The figure given below shows an original image of the Map widget.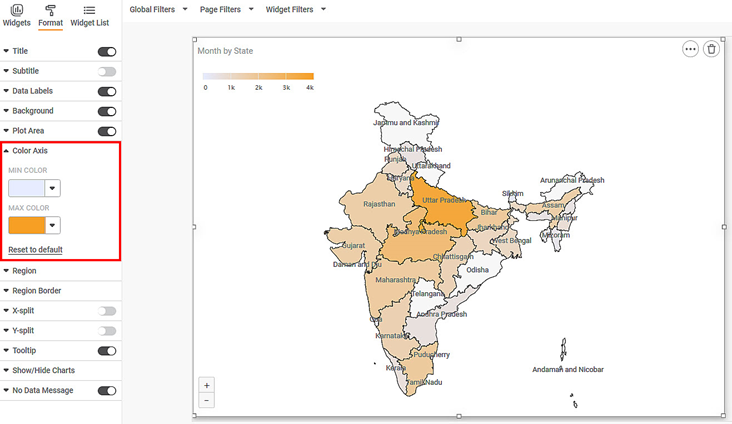
Now,
- Change the MIN COLOR
- Change the MAX COLOR
The resultant widget is shown below.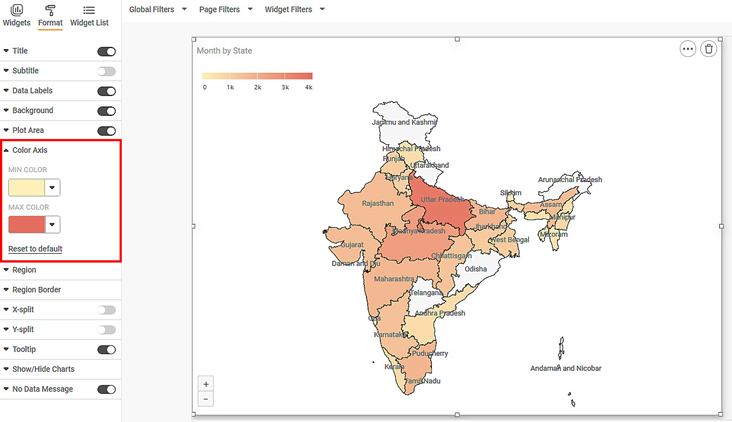
Related Articles
Axis
Here, the word 'Axis' refers to the X-axis. The figure below shows the various fields present in the Axis formatting in the X-axis. The table given below describes different fields available for Axis formatting for X-axis. Field Description Remark ...Axis Title ( Y-axis)
Axis title is the heading that you want to give to the Y-axis. The table given below describes different fields present on Axis Title formatting in Y-axis. Field Description Remark Text It allows you to give a suitable title to the axis. Axis title ...Axis Label (Y-axis)
Axis Label is the parameter that represents the variable plotted on the Y-axis. The table given below describes different fields present on Axis Label formatting in Y-axis. Field Description Remark Text It allows you to modify the parameters of the ...Axis Title
The Axis title is the heading that you want to give to the X-axis. The table given below describes different fields present on Axis Title formatting in X-axis. Field Description Remark Text It allows you to give a suitable title to the axis. Axis ...Axis Label
This formatting option allows you to make the following changes to the Axis Label. You can change the text font and also its size and color. You can make the text bold, italic, and underline it. Axis Label is the parameter that represents the ...