Creating Custom Visualization Using Python Widget
The Python widget in RubiSight allows you to create custom data visualizations that are not already available in RubiSight.
To create a custom visualization, you need to write Python code in the code editor. The Python widget supports libraries such as Matplotlib, Plotly, and Seaborn.
Let's create a custom visualization using the Python widget.
- Create a dashboard and add the required dataset.
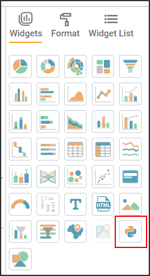
- From the widget list, select the Python widget.
The code editor appears at the bottom. - Click on Show.
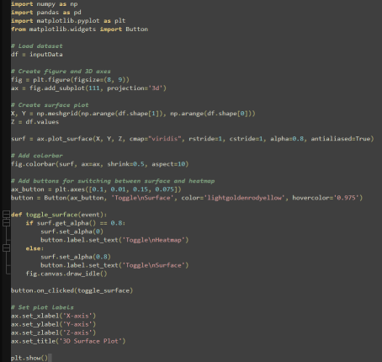
- Write Python code with the required parameters. Refer to the code snippet below.
- Click Save & Plot.
The following figure displays the customized chart: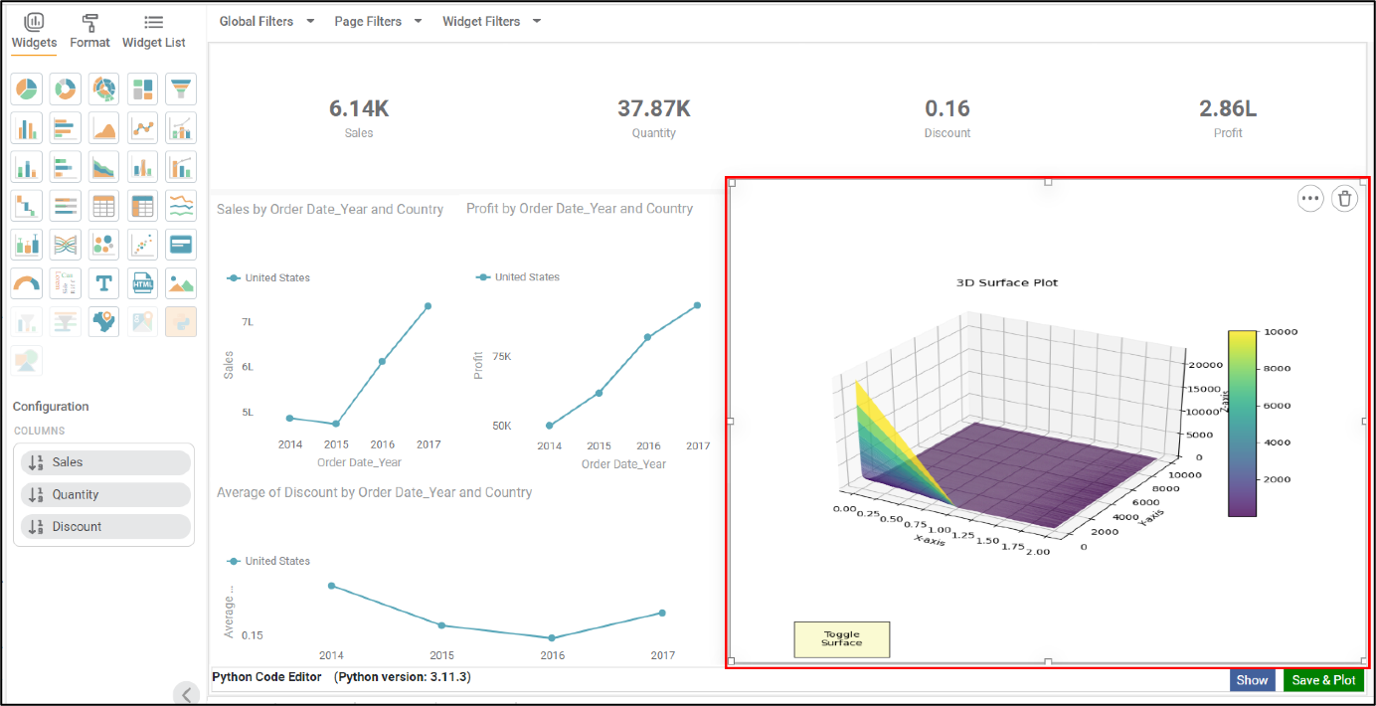
Related Articles
Creating a Map Widget
In RubiSight, you can create a map widget if your dataset contains geographical variables. Geographical Variable In RubiSight, a new variable type called geographical is added to represent a location. It is supported for the below-listed location ...Creating a Google Map Widget
Plotting Google Map Widget (Release 4.2 Onwards) Overview The Google Map widget in RubiSight allows you to visualize geographical data using latitude and longitude coordinates. Data points can be displayed as map markers or circles on the map based ...Creating Visualization using Widgets on Dashboard
You can create different visualizations using the different types of widgets provided by RubiSight. When the same data is represented in different ways, it can give different insights and help the decision-making process. The following sections ...Custom Functions in RubiPython
Reading Data from File A sample Python code to read data from file is shown in the image below. The table below explains the above code snippet. Line of Code Result getReaderData(“datasetName”,“subdatasetName”) This custom function checks the type of ...Custom Functions in RubiPython
Reading Data from File A sample Python code to read data from file is shown in the image below. The table below explains the above code snippet. Line of Code Result getReaderData(“datasetName”,“subdatasetName”) This custom function checks the type of ...