Data Compare
Data Compare is located under Model Studio (.png) ) in Data Preparation, in the task pane on the left. Use the drag-and-drop method to use the algorithm in the canvas. Click the algorithm to view and select different properties for analysis.
) in Data Preparation, in the task pane on the left. Use the drag-and-drop method to use the algorithm in the canvas. Click the algorithm to view and select different properties for analysis.
In the Data Compare algorithm, you can combine two or more datasets to create one dataset based on certain conditions.
Properties of Data Compare
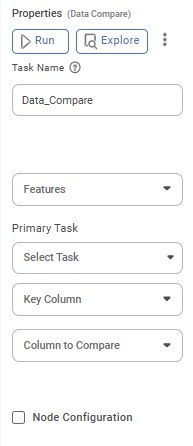
The table given below describes the different fields present on the Properties pane of Data Compare.
Field | Description | Remark | |
| Run | It allows you to run the node. | - | |
| Explore | It allows you to explore the successfully executed node. | - | |
| Vertical Ellipse | The available options are
| - | |
Task Name | It displays the name of the selected task. | You can click the text field to edit or modify the name of the task as required. | |
Features | It allows you to select the columns that you want to display on the result page. |
| |
Select Task | It allows you to select the primary task from the list of tasks to be compared. | — | |
Key Column | It allows you to choose one or more columns that exist in both datasets to use as keys for matching. | — | |
Column to Compare | It allows you to select one or more numeric columns (shared across both datasets) for comparison. | — | |
Threshold | It allows you to set the threshold value. After selecting columns to compare, a threshold box will appear. If you enter values in the Min and Max fields, the threshold will be applied; otherwise, it will be ignored. If the 'Percent' checkbox is selected, the threshold values will be treated as percentages. | You can enter any values in the Min and Max fields | |
Advanced | Node Configuration | It allows you to select the instance of the AWS server to provide control on the execution of a task in a workbook or workflow. | For more details, refer to Worker Node Configuration. |
Example of Data Compare with two Datasets
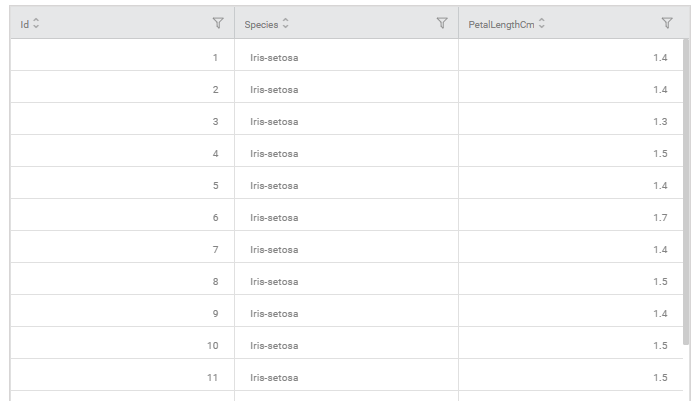
In the example, Iris1 and Iris2 are the two datasets to be compared.
The figure given below displays the input data from Iris_1.
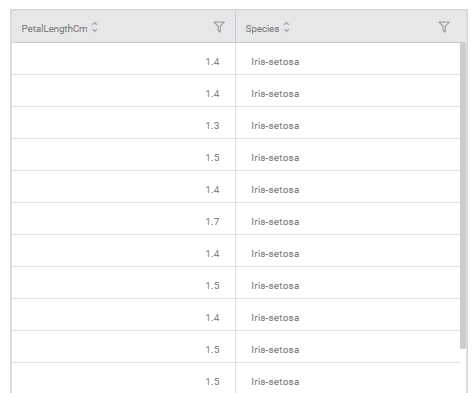
The figure given below displays the input data from Iris_2.
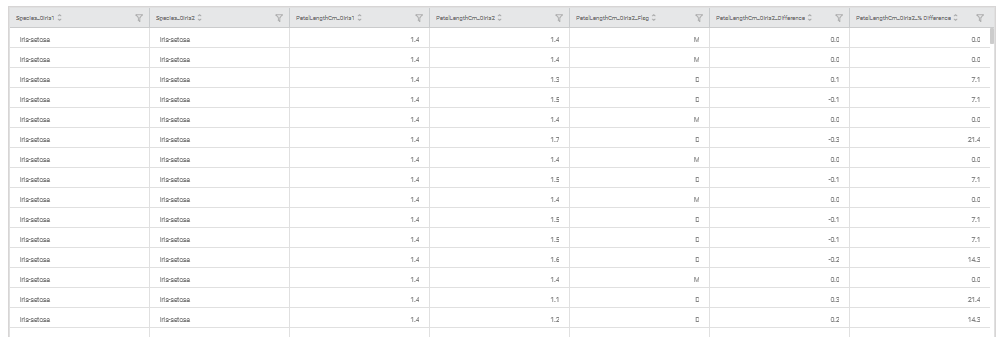
The figure given below displays the output data obtained after applying the data compare.
Related Articles
Model Compare
Working with Model Compare To start working with Model Compare, follow the steps given below. Go to the Home page and create a new workbook or open an existing workbook. Drag and drop the required dataset on the workbook canvas. In the Properties ...Live Data
Data visualization is the representation of data in the form of pictures, images, graphs, or any other form of visual illustration. In RubiThings, Live Data is visualized in the form of Line Chart, SolidGauge, and Speedometer. To fetch the live data, ...Data Merge
Data Merge is located under Model Studio ( ) in Data Preparation, in the task pane on the left. Use drag-and-drop method to use the algorithm in the canvas. Click the algorithm to view and select different properties for analysis. Properties of Data ...Data Merge
Data Merge is located under Model Studio ( ) in Data Preparation, in the task pane on the left. Use drag-and-drop method to use the algorithm in the canvas. Click the algorithm to view and select different properties for analysis. Properties of Data ...Data Preparation
Time-series Data Preparation organizes and formats transactional data into time-series data to predict trends and seasonality in the data. Transactional data is timestamped data recorded over a period at no specific frequency, while time-series data ...