Data Preparation
Time-series Data Preparation organizes and formats transactional data into time-series data to predict trends and seasonality in the data.
Transactional data is timestamped data recorded over a period at no specific frequency, while time-series data is timestamped data recorded over a period at a particular frequency. The frequency or time interval can be from seconds to yearly or any other decided interval.
Transactional data is converted into time-series data by attributing frequency to the data. This is achieved by bundling or aggregating the transactional data into time-series data of the selected interval. Transactional data, when attributed with frequency, can be analyzed as time-series data.
Why is Time-series Data Preparation required
You can predict trends and seasonal variations in the time-series data that are not visible in transactional data.
How is Time-series Data Preparation done in rubiscape
Using the Rubiscape Time-series Data Preparation feature, you can analyze your time-series data by performing the following tests.
- Accumulation
- Missing value imputation
- Transformation
- Differencing
The feature converts the irregularly recorded timestamped data into data at the time interval defined by you. You can then run either one or more of the four data preparation tests in rubiscape, in any order you want. You can also run all four available tests simultaneously. When all the tests are selected to run, the tests are executed in the order – accumulation, missing value imputation, transformation, and differencing.
- In accumulation, the time-series data is aggregated in the selected time interval.
- In missing value imputation, the missing values in the data are removed or replaced in the accumulated time-series data.
- In transformation, the time-series data is normalized. The data is rescaled from the original range to a new range between 0 and 1.
In differencing, the seasonality in the time-series data is identified and removed to make the data stationary.
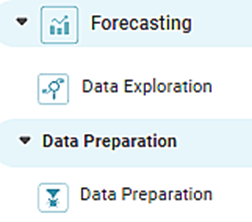
 ), in the task pane on the left. Use the drag-and-drop method to use the algorithm in the canvas. Click the algorithm to view and select different properties for analysis.
Refer to Properties of Time-series Data Preparation.
Time-series Data Preparation is an algorithm in which a given data is converted into time-series data of the selected interval in a specific time format. You cannot use this algorithm unless you have selected the time format.
Properties of Time-series Data Preparation
The available properties of time-series Data Preparation in Forecasting are as shown in the figure given below.
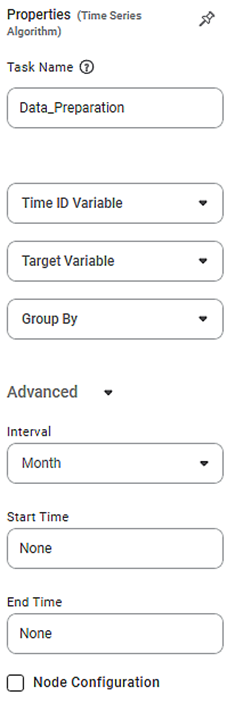
The table given below describes the different fields present in the properties of time-series Data Preparation in Forecasting.
Field | Description | Remark | |
Task Name | It displays the name of the selected task. | You can click the text field to edit or modify the name of the task as required. | |
Time ID Variable | It allows you to select the interval type variable for which we need to process the dependent or target variable's values. |
| |
Target Variable | It allows you to select the experimental or predictor variable(s). |
| |
Group By | It allows you to select the variable for which you want to group the data. |
| |
Advanced | Interval | It allows to select the interval for the accumulation of data in the accumulation test. | Available options are –
The default value is Month. |
Time Format | It allows to select the time format to display the result of the selected tests. | – | |
Start Time | It allows to set the start time of the time-series data. |
| |
End Time | It allows to set the end time of the time-series data. |
| |
Notes: |
|

Time-series Data Preparation Tests in Forecasting
The different tests available in Time-series Data Preparation under Forecasting are given below.
Accumulation
Accumulation | |||
Description | Accumulation is data aggregation in the time domain. Accumulation combines the data within the same time interval to give a summary output for that period. | ||
Why to use | The data accumulation process is used to
| ||
When to use | To discover trends and seasonal variations based on time-series data. | When not to use | On non-interval data. |
Prerequisites |
| ||
Input | Any dataset that contains a time interval. | Output | The summarized time-series data based on the selected time interval. |
Statistical Methods used |
| Limitations | Not applicable for sequential datasets (that is, data that does not include the datetime column). |
Functions of Accumulation Test
The table given below describes the functions of the Accumulation test.
Function | Description | Remark |
Sum | It gives the accumulation of the time-series data by the sum of the values in the given interval. | It can be performed only on numerical data. |
Mean | It gives the accumulation of the time-series data by the mean of the values in the given interval. | It can be performed only on numerical data. |
Minimum | It gives the accumulation of the time-series data by the minimum value in the given interval. | It can be performed only on numerical data. |
Median | It gives the accumulation of the time-series data by the median value in the given interval. | It can be performed only on numerical data. |
Maximum | It gives the accumulation of the time-series data by the maximum value in the given interval. | It can be performed only on numerical data. |
Missing Value
Missing Value | |||
Description | The time-series data may contain missing values that need to be imputed. The time-series missing value interpretation imputes the missing information in time-series data. The time-series missing value interpretation is performed only on missing values. The values present in the dataset remain unchanged. | ||
Why to use | To impute missing values in the time-series data. | ||
When to use | For analysis of time-series data without losing the variation in the data. | When not to use | When data do not contain any missing values. |
Prerequisites | The time interval for the data to be analyzed should be specified. | ||
Input | Time-series data with fixed time interval or time-series data. | Output | A complete time-series data for the specified time interval having no missing values. |
Statistical Methods used |
| Limitations |
|
Functions of Missing Value Test
The table given below describes the functions of the Missing Value test.
Table: Description of Functions of Missing Value Test
Function | Description | Remark |
Mean | It replaces the missing values with the mean of the non-missing values within each column separately and independently from the others. |
|
Median | It replaces the missing values with the median of the non-missing values within each column separately and independently from the others. |
|
Min | It replaces the missing values with the minimum value present in that column. | – |
Max | It replaces the missing values with the maximum value present in that column. | – |
Remove | It discards the rows that contain missing values. |
|
Constant | It replaces the missing values with the constant value that you have entered. |
|
Random | It replaces the missing values with random values from that column. | It can only be used with numerical data. |
Transformation
Transformation | |||
Description | Data transformation in time-series data removes noise and improves the signal in time-series forecasting. There are different functions used to transform time-series data, useful for visualizing time-series data and modeling the time-series data. An inverse transform is applied to the predictions of a transform function applied to time-series data. This ensures that the resultant performance measures are on the same scale as the output variable. The transformation method assumes that the time-series data is positive and non-zero. | ||
Why to use | To stabilize the variance across time in time-series data for more accurate forecasts. | ||
When to use | To simplify patterns in time-series data by removing variation across time or by making the pattern consistent across the dataset. | When not to use | When the data is already normalized between 0 and 1. |
Prerequisites |
| ||
Input | High variance time-series data. | Output | Time-series data with less variance and consistent pattern. |
Statistical Methods used |
| Limitations | Log and Natural Log functions are not applicable to data that contains zero. Since log(0) = -Inf. |
Functions of Transformation Test
The table given below describes the functions of the Transformation test.
Function | Description | Remark |
Exponential | It transforms the time-series by taking the exponential e (2.7183) of the values in the given interval. | It can only be used with numerical data. |
Square | It transforms the time-series by taking the square of the values in the given interval. | It can only be used with numerical data. |
Square Root | It transforms the time-series by taking the square root of the values in the given interval. | It can only be used with numerical data. |
Natural Log | It transforms the time-series by taking the natural logarithm (logarithm to the base 10) of the values in the given interval. | It can only be used with numerical data. |
Log | It transforms the time-series by taking the logarithm (logarithm to the base 2) of the values in the given interval. | It can only be used with numerical data. |
Inverse Exponential | It transforms the time-series by taking the inverse exponential of the values in the given interval. | It can only be used with numerical data. |
Inverse Square | It transforms the time-series by taking the inverse square of the values in the given interval. | It can only be used with numerical data. |
Inverse Square Root | It transforms the time-series by taking the inverse square root of the values in the given interval. | It can only be used with numerical data. |
Inverse Natural Log | It transforms the time-series by taking the inverse natural logarithm of the values in the given interval. | It can only be used with numerical data. |
Inverse Log | It transforms the time-series by taking the inverse logarithm of the values in the given interval. | It can only be used with numerical data. |
Differencing
Differencing | |||
Description | Differencing is a method of transforming time-series data by removing the trends and seasonality in the data to make the time-series data stationary. In non-stationary time-series data, trends result in varying mean over time, while seasonality results in variance over time. Stationary datasets have a stable mean and variance and hence are easier to model. In differencing, the previous observation is subtracted from the current observation. In a time-series data with a lag of n, differencing converts every ith observation of the series into its difference from the (i-n)th observation. | ||
Why to use | To make time-series data stationary since stationary data with stable mean and variance is easier to model. | ||
When to use | For removing trends and seasonality in time-series data before modeling. | When not to use | When data is already stationary. |
Prerequisites |
| ||
Input | The transformed time-series data. | Output | Stationary time-series data. |
Statistical Methods used | Lag Difference | Limitations | The lag difference should be less than the number of data points in the data. |
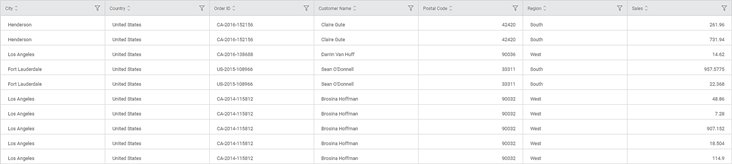
Example of Time-series Data Preparation
Consider an example of Sales time-series data. Here, the variable Date is of interval type.
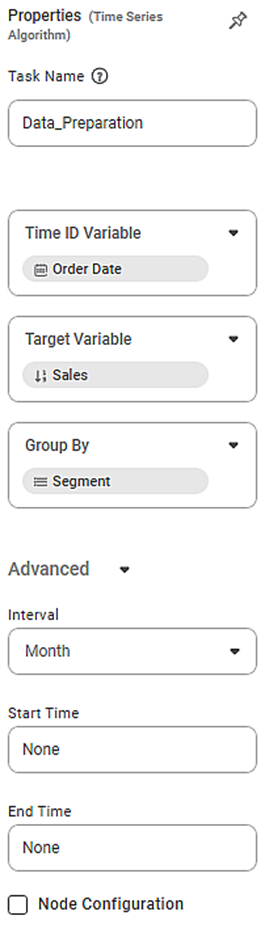
In the Properties pane, the values are selected as below.
| Property | Value |
|---|---|
| Time ID | Order Date |
| Target Variable | Sales |
| Group By | Segment |
| Interval | Month |
The figure below shows the values selected.
We apply Data Preparation on the above data.
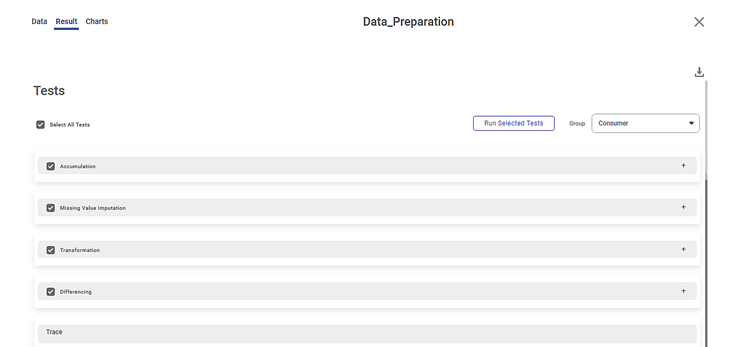
On the Result page, you can see Group as Consumer based on the selection in Group By in the Properties pane. When you select the check box for Select All Tests, all the four tests, Accumulation, Missing Value, Transformation, and Differencing are selected. Trace displays the log of the selected tests when they are executed. It logs the number of times each test starts and ends, based on the option selected in Group By.
Note: | You can also execute each test independently by selecting the corresponding check box, selecting the required values in the fields corresponding to the selected test, and then clicking Run Test. |
When you click Run Selected Tests, the tests are performed based on the default function and values in the fields corresponding to each test. The result for each test is displayed in the figures given below.
Interpretation of Result of Accumulation Test
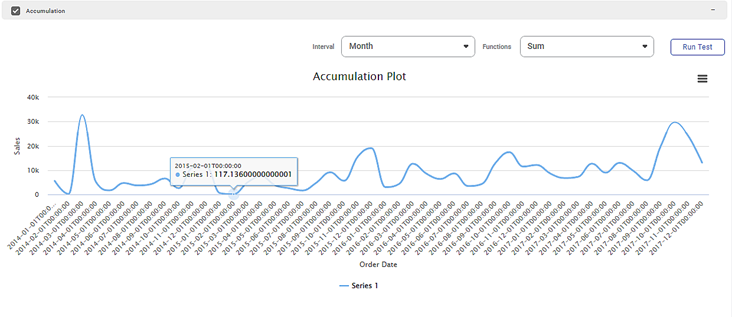
In the above figure, the Accumulation test result plot displays the monthly Sales Rate time-series data. The time-series data displayed is accumulated by the sum of the values in the interval.
Interpretation of Result of Missing Value Test

In the above figure, the Missing Value test result plot displays the monthly Sales time-series data. The time-series data displayed is imputed by replacing the missing values in the accumulated data with random values.
Interpretation of Result of Transformation Test
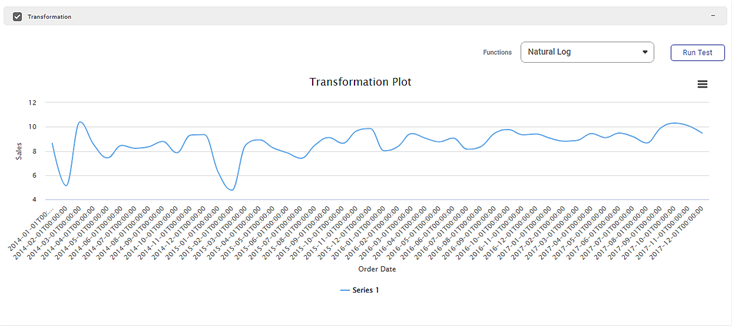
In the above figure, the Transformation test result plot displays the monthly Sales time-series data. The time-series data displayed is transformed using the natural logarithm (logarithm to the base 10) of the values.
Interpretation of Result of Differencing Test
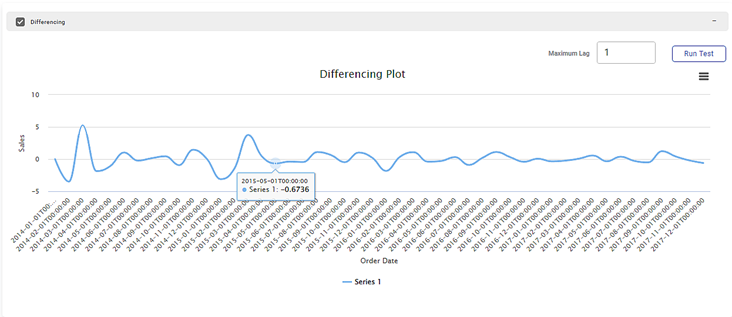
In the above figure, the Differencing test result plot displays the stationary Sales time-series data. The monthly stationary time-series data is displayed by subtracting each previous observation from its current observation by the default lag value, which is 1.
Notes: |
|
Related Articles
Data Merge
Data Merge is located under Model Studio ( ) in Data Preparation, in the task pane on the left. Use drag-and-drop method to use the algorithm in the canvas. Click the algorithm to view and select different properties for analysis. Properties of Data ...Data Merge
Data Merge is located under Model Studio ( ) in Data Preparation, in the task pane on the left. Use drag-and-drop method to use the algorithm in the canvas. Click the algorithm to view and select different properties for analysis. Properties of Data ...Data Compare
Data Compare is located under Model Studio ( ) in Data Preparation, in the task pane on the left. Use the drag-and-drop method to use the algorithm in the canvas. Click the algorithm to view and select different properties for analysis. In the Data ...Data Joiner
Data Joiner is located under Model Studio ( ) in Data Preparation, in the task pane on the left. Use the drag-and-drop method to use the algorithm in the canvas. Click the algorithm to view and select different properties for analysis. Refer to ...Data Joiner
Data Joiner is located under Model Studio ( ) in Data Preparation, in the task pane on the left. Use the drag-and-drop method to use the algorithm in the canvas. Click the algorithm to view and select different properties for analysis. Refer to ...