Filter Column
Filter Column in rubiscape allows to choose between the columns in the table you want to keep and remove. Also, it allows you to rename the columns and pass them to the successor node.
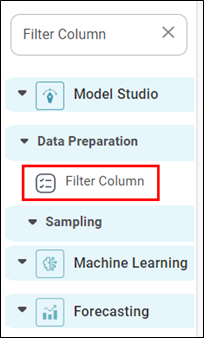
Filter Column is located under Model Studio >> Data Preparation >> Filter Column, in the task pane on the left. Use the drag-and-drop method to use the algorithm in the canvas. Click the algorithm to view and select properties.
Properties of Filter Column
Field | Description | Remark |
| It helps to execute the node. | -- |
| It helps to explore the successful node. | -- |
| It displays the following options in the list view.
| -- |
Task Name | It is the name of the task selected on the workbook canvas. | You can click the text field to edit or modify the task name as required. |
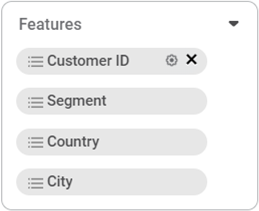
Features | It allows you to select the variable from the drop-down list for filtering. | You can remove or rename the columns. |

Example of Filter Column
Let us use the Filter Column node on the Dataset.
The snippet below shows the algorithm flow.
- Select the Features arrow

- Uncheck (Select All) and select the columns you want to show. Click Done.
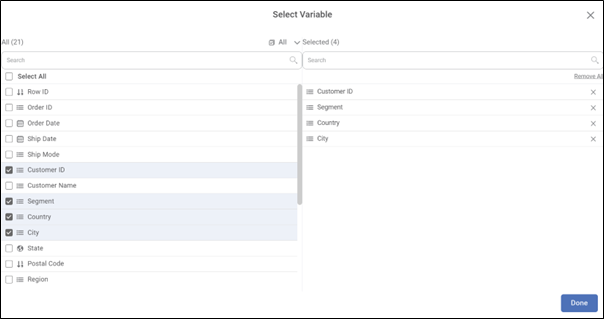
- Features shows the filtered columns.
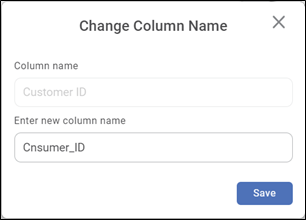
- Now, to rename the column, select the
- Enter the new column name and Click Save.
Related Articles
Drill Through from Chart to Page with Context Filtering
Drill Through Filters (Page Level) Overview Drill Through Filter option is available at the page level in the Filter Pane and is accessible from Edit/View/Outer modes. It enables navigation from one widget to another page while passing contextual ...Interactivity Filter
An interactivity filter is functionality that shows the auto-responsiveness of the chart in the view mode. Using an interactivity filter, you can drill down the information given by the chart to the minute details. Interactivity is always applied on ...Page Filter
The Page Filter option is always available on the filter pane of the Dashboard canvas. The page filters apply to all the charts plotted on a page of the Dashboard. To apply a Page Filter, follow the steps given below. Create the number of charts as ...Applying Filter to a Feature
To filter a feature in a dataset, follow the steps given below: Perform steps 1 to 4 of Exploring a Dataset. The explored dataset is displayed on the Data page. Click the filter icon () next to the Feature that you want to filter. A filtering dialog ...Column
The column formatting option is available in widgets that contain Tables. The table given below describes different fields present on Column formatting. Field Description Remark Header Font Font of the Header row — Background Color It allows you to ...