Interactivity Control
Interactivity is functionality that shows the auto-responsiveness of the chart in the view mode. We always apply interactivity to the dimensions. Using an interactivity control, you can turn interactivity ON or OFF for the preferred chart(s) that exists on the dashboard.
To use interactivity control, follow the steps given below,
- Create the number of charts as required. Refer to Creating Chart Using Widgets.
- Select any widget on the dashboard canvas.
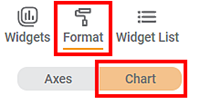
- In the Widget pane, click Format.
- Click Chart.
The formatting options for the chart are displayed. - To turn interactivity ON or OFF, you can use the toggle button. By default, the interactivity control is ON (
 ).
).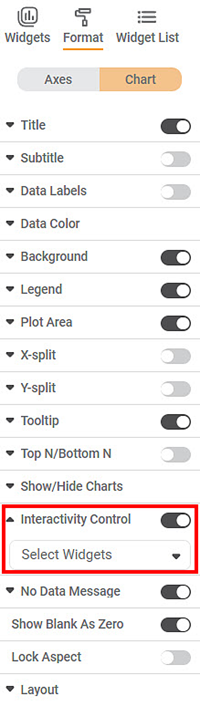
- Click the interactivity control drop-down menu. The "Select Widget" button will be displayed.
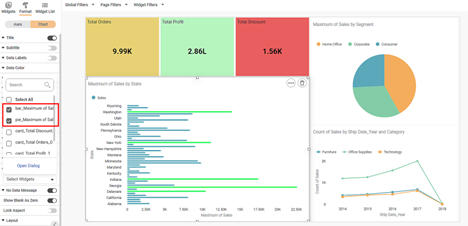
- Select the select widget drop-down button. It will display a list of all the widgets present on the dashboard.
- Select the desired chart from the list. For example, here we select Bar Chart and Pie Chart from the list.
- Click Save.
- Click View Mode to open the dashboard in view mode.
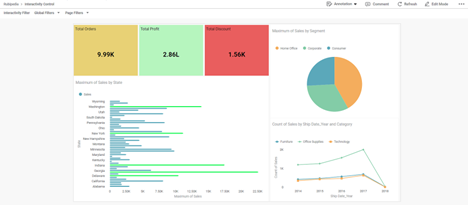
- From the chart, click the column name on which you want to apply the filter. For example, here, we apply an interactivity filter on the State - "Florida".
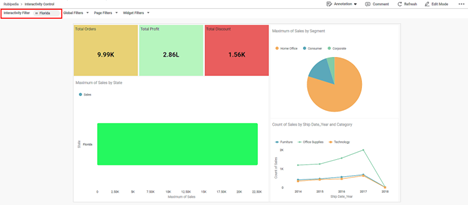
The interactivity filter applies only to the charts selected in the interactivity control's select widget list.
Related Articles
Interactivity Filter
An interactivity filter is functionality that shows the auto-responsiveness of the chart in the view mode. Using an interactivity filter, you can drill down the information given by the chart to the minute details. Interactivity is always applied on ...Using Snapshot for Version Control
What is a Snapshot The snapshot feature allows you to perform version control. You can take backup of your Workbook or Workflow at any point in time. These snapshots can be restored as and when required. The snapshot feature is available in Workbook ...Using Snapshot for Version Control
What is a Snapshot The snapshot feature allows you to perform version control. You can take backup of your Workbook or Workflow at any point in time. These snapshots can be restored as and when required. The snapshot feature is available in Workbook ...User Defined Widget Name
The Widget Name Formatter allows users to assign meaningful, custom names to widgets across all chart and widget types in RubiSight dashboards. This helps in easy identification of widgets during interactions such as filtering, interactivity control, ...Creating a Google Map Widget
Plotting Google Map Widget (Release 4.2 Onwards) Overview The Google Map widget in RubiSight allows you to visualize geographical data using latitude and longitude coordinates. Data points can be displayed as map markers or circles on the map based ...