Line Style
Line Style feature allows you to customize the appearance of the lines in the widgets. It helps you to tailor the visualizations to meet your specific needs and preferences. This feature is available in the following widgets: Line, Pareto, Combination, and Sparkline.
To customize the line style, go to Widget > Format > Chart > Line Style.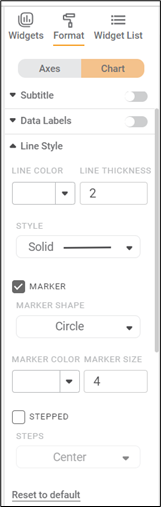
The table below describes the different fields present in the Line Style formatting:
Field | Description | Remarks |
Line Color | It allows you to select the color of the line. | The default color is white. |
Line Thickness | It allows you to specify the width of the line. | __ |
Style | The style of the line defines its pattern. | The available patterns are:
|
Marker | Markers are the small symbols used to highlight the datapoints on the line. | __ |
Marker Shape | It specifies the shape of the marker. | The available marker shapes are:
|
Marker Color | This defines the color of the marker. | __ |
Marker Size | It is used to set the size of the marker. | __ |
Stepped | It is used to draw the line in steps rather than continuous line. | __ |
Steps | It determines the style of the stepped line | Available styles are
|
Example: Customizing line in a widget.
First, we'll plot a line chart using dimensions and measures from the dataset. In this example, we'll plot the Maximum of Income by Ethnicity and Gender. The snippet below displays the default chart.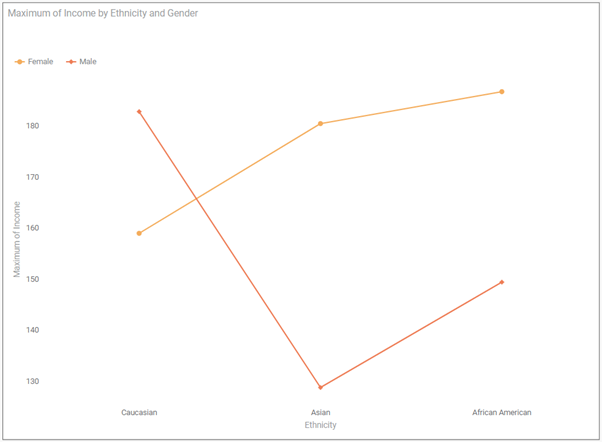
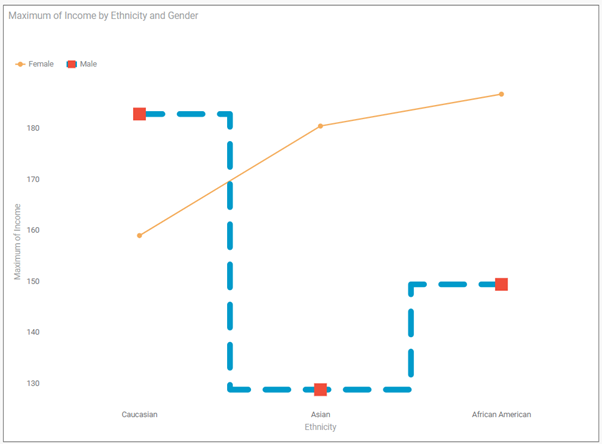
Now, we'll customize the line style by changing the line color, thickness, and style, as well as the marker style options, such as marker color, marker Size, and steps.
- Line Color: Blue
- Line Thickness: 9
- Line Style: Dash (--)
- Marker Style: Square (s)
- Marker Color: Red
- Marker Size: 10
- Steps: Center
Below is the resulting customized chart.
Related Articles
Grid Line
Gridlines are a crisscross mesh of lines drawn in the region between X and Y axes in a graph or chart. The table given below describes different fields present on Grid Line formatting on Y-axis. Field Description Remark Width It allows you to select ...Fixed Line
The figure given below shows the Add Fixed Line page. The table given below describes different fields present on Add Fixed Line page. Section Field Description Remark Line Name It allows you to select a name for the Fixed Line. · Select a proper ...Grid Line
Gridlines are a crisscross mesh of lines drawn in the region between X and Y axes in a graph or chart. The table given below describes different fields present on Grid Line formatting on X-axis. Field Description Remark Width It allows you to select ...Aggregate Line
The figure given below shows the Add Aggregate Line page. The table given below describes different fields present on Add Aggregate Line page. Section Field Description Remark Line Name It allows you to select a name for the Aggregate Line. · Select ...Table Style
When you select a table style, you choose the way the table should appear. The table styles are explained in the table below. The table given below describes different fields present on Table Style formatting. Field Description Remark Style It ...