Mann Whitney U Test
Mann Whitney U Test is located under Model Studio (  ) in Statistical Analysis below Hypothesis Test, under Non-Parametric Test in the left task pane. Use the drag-and-drop method or double-click to use the algorithm in the canvas. Click the algorithm to view and select different properties for analysis.
Properties of Mann Whitney U Test
The available properties of the Mann Whitney U Test are shown below.
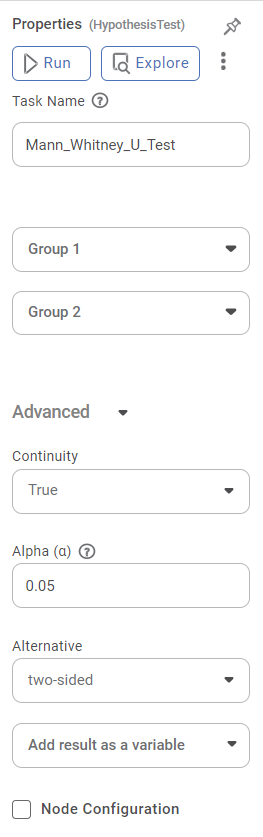
The table below describes the different properties of the Mann Whitney U Test.
Field | Description | Remark | |
|---|---|---|---|
| Run | It allows you to run the node. | - | |
| Explore | It allows you to explore the successfully executed node. | - | |
| Vertical Ellipses | The available options are
| - | |
Task Name | It is the name of the task selected on the workbook canvas. |
| |
Group 1 | It allows you to select the independent variable. |
| |
Group 2 | It allows you to select the independent variable. |
| |
Advanced | Continuity | It tells if a continuity correction should be applied or not. |
|
Alpha | It allows you to enter the alpha value or a significance level |
| |
Alternative | Defines the alternative hypothesis. |
| |
Node Configuration | It allows you to select the instance of the AWS server to provide control over the execution of a task in a workbook or workflow. | For more details, refer to Worker Node Configuration. | |
Example of Mann Whitney U Test
As a medical researcher, you wish to compare two independent drugs, Drug 1 and Drug 2 on their level of effectiveness. You use the Mann Whitney U test to determine whether the two drugs differ in their effectiveness.
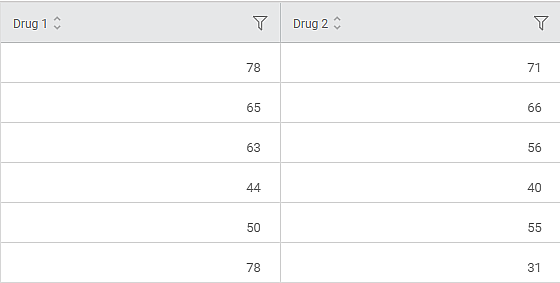
The data tab shows the selected input columns. These are the two numeric data groups that are used for the comparison.
Further, the Result page is as follows.
The result page consists of the following sections:
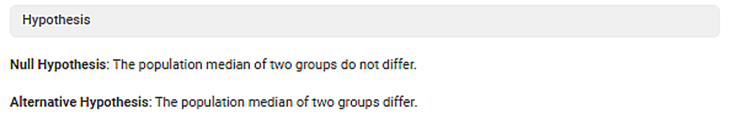
1. Hypothesis:
This section displays Null Hypothesis and Alternative Hypothesis defined by the system.
2. Mann Whitney U Test:
This section displays the Mann Whitney U Test Rank test result. It shows value of the U Statistic, p Value and Alpha (α).
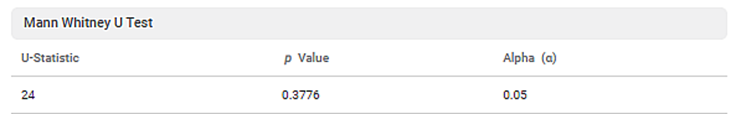
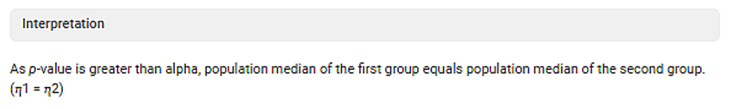
3.Interpretation:
In this example, the p value (0) is less than the alpha value (0.05); hence the null hypothesis is rejected. The rejection of the null hypothesis means that the population median of the first group differs from that of the second group.
Related Articles
Word Embeding
Word Embedding is located under Textual Analysis in Pre processing on the left task pane. Alternatively, use the search bar for finding the Word Embedding feature. Use the drag-and-drop method or double-click to use the algorithm in the canvas. Click ...Word Embeding
Word Embedding is located under Textual Analysis in Pre processing on the left task pane. Alternatively, use the search bar for finding the Word Embedding feature. Use the drag-and-drop method or double-click to use the algorithm in the canvas. Click ...Two Sample Z Test
Two Sample Z Test Description Two sample Z test is a statistical test used to determine whether there is a significant difference between the means of two independent variables. Why to use To compare the means of two independent variables When to use ...Train Test Split
Train Test Split is located under Model Studio () under Sampling in Data Preparation, in the left task pane . Use the drag-and-drop method to use the algorithm in the canvas. Click the algorithm to view and select different properties for analysis. ...Train Test Split
Train Test Split is located under Model Studio ( ) under Sampling in Data Preparation, in the left task pane . Use the drag-and-drop method to use the algorithm in the canvas. Click the algorithm to view and select different properties for analysis. ...