MLP Neural Network in Regression
The MLP Neural Network is located under Machine Learning in Regression, on the left task pane. Alternatively, use the search bar for finding the MLP Neural Network algorithm. Use the drag-and-drop method or double-click to use the algorithm in the canvas. Click the algorithm to view and select different properties for analysis.

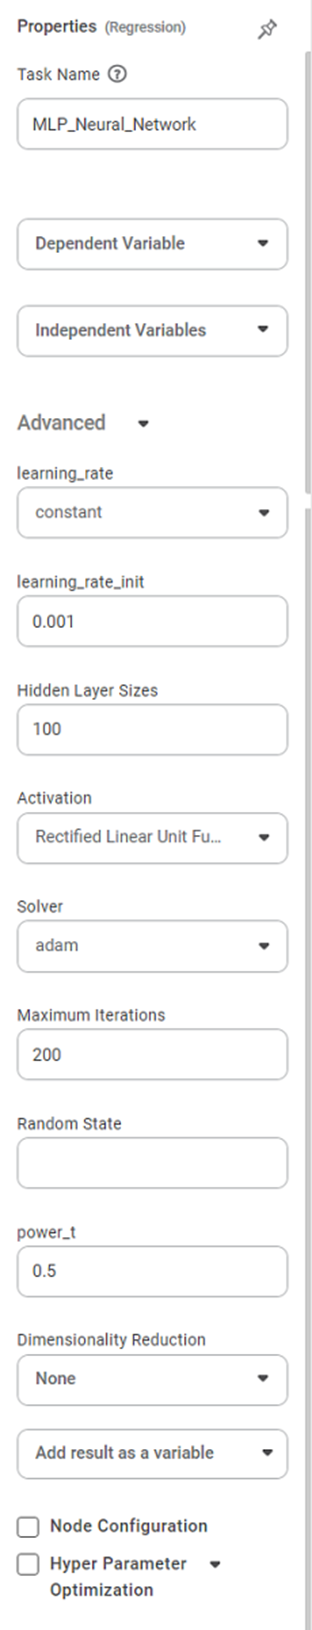
Properties of MLP Neural Network in Regression
Field | Description | Remark | |
| Run | It allows you to run the node. | - | |
| Explore | It allows you to explore the successfully executed node. | - | |
| Vertical Ellipses | The available options are
| - | |
Task Name | It displays the name of the selected task. | You can click the text field to modify the task name as required. | |
Dependant Variable | It allows you to select the dependent variable. | You can select only one variable, and it should be of | |
Independent Variable | It allows you to select the independent variable | You can choose more than one variable. | |
Advanced | Learning_rate | It allows you to select the constant, in-scaling, or adaptive learning rate. | It is a hyperparameter that controls the step size at which the weights and biases of the network are updated during the training process. |
Learning_rate_init | It allows you to enter the learning rate value. | It refers to the initial learning rate used at the beginning of the training process. | |
Hidden Layer Sizes | It allows you to enter the number of hidden layers. You can add multiple values separated by comma. | It refers to the number of neurons or units in each hidden layer of the network. | |
Activation | It allows us to choose no-op, logistic sigmoid, hyperbolic tan, and rectified linear unit functions. | It is a mathematical function applied to the weighted sum of the inputs to each neuron in a hidden layer or the output layer. | |
Solver | It allows us to choose lbfgs, sgd, and adam. | It refers to the optimization algorithm used to update the weights and biases of the network during the training process. | |
Maximum Iterations | It allows us to enter the number of iterations. | It refers to the maximum number of iterations or epochs that the training process will run. | |
Random State | It allows us to enter the number of random states we want. | It is a parameter that controls the random initialization of the network's weight and biases. | |
Power_t | It allows us to select the power level. | It determines the convergence criterion for the optimization algorithm. | |
Dimensionality Reduction | It allows you to select between None and PCA. | It to the process of reducing the number of input features or variables in a dataset while preserving the important information and patterns present in the data. | |
Example of MLP Neural Network
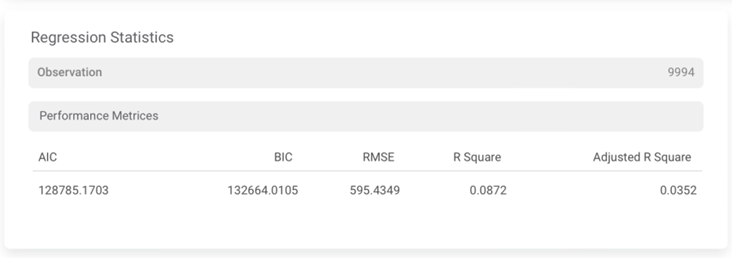
In the example given below, the MLP Neural Network Regression is applied to the Superstore dataset. The independent variables are Country, City, and Category, etc. Quantity is selected as the dependent variable.
The result page displays the following sections.
Section 1 - Event of Interest

Performance Metric | Description | Remark |
|---|---|---|
RMSE (Root Mean Squared Error) | It is the square root of the averaged squared difference between the actual values and the predicted values. | It is the most commonly used performance metric of the model. |
R Square | It is the statistical measure that determines the proportion of variance in the dependent variable that is explained by the independent variables. | Value is always between 0 and 1. |
Adjusted R Square | It is an improvement of R Square. It adjusts for the increasing predictors and only shows improvement if there is a real improvement. | Adjusted R Square is always lower than R Square. |
AIC (Akaike Information Criterion) | AIC is an estimator of errors in predicted values and signifies the quality of the model for a given dataset. | A model with the least AIC is preferred. |
BIC | BIC is a criterion for model selection amongst a finite set of models. | A model with the least BIC is preferred. |
| MSE (Mean Squared Error) | It is the averaged squared difference between the actual values and the predicted values. | A model with low MSE is preferred. |
| MAE (Mean Absolute Error) | It the absolute value of difference between actual and predicted values | A model with low MAE is preferred. |
| MAPE ( Mean Absolute Percentage Error) | it is the average magnitude of error produced by a model, or how far off predictions are on average. | A model with low MAPE is preferred |
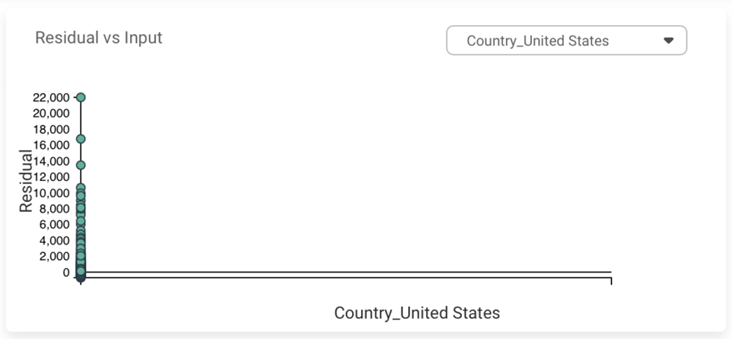
Section 2 – Residuals Vs. Inputs
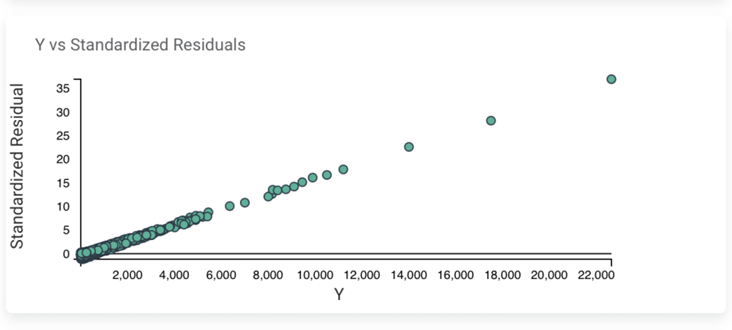
Section 3 – Y Vs. Standardized Residuals
Section 4 – Residuals Probability Plot
Related Articles
Classification
Notes: The Reader (Dataset) should be connected to the algorithm. Missing values should not be present in any rows or columns of the reader. To find out missing values in a data, use Descriptive Statistics. Refer to Descriptive Statistics. If missing ...Model Compare
Working with Model Compare To start working with Model Compare, follow the steps given below. Go to the Home page and create a new workbook or open an existing workbook. Drag and drop the required dataset on the workbook canvas. In the Properties ...Poisson Regression
Poisson Regression is located under Machine Learning () under Regression, in the left task pane. Use the drag-and-drop method to use the algorithm in the canvas. Click the algorithm to view and select different properties for analysis. Refer to ...Linear Regression
Linear Regression is located under Machine Learning ( ) in Regression, in the task pane on the left. Use the drag-and-drop method to use the algorithm in the canvas. Click the algorithm to view and select different properties for analysis. Refer to ...Polynomial Regression
Polynomial Regression is located under Machine Learning () under Regression, in the left task pane. Use the drag-and-drop method to use the algorithm in the canvas. Click the algorithm to view and select different properties for analysis. Refer to ...