One Sample Proportion Test
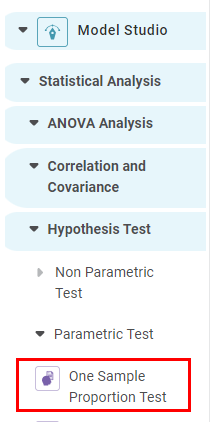
One Sample Proportion Test is located under Model Studio in Statistical Analysis below Hypothesis Test, Parametric Test in the left task pane. Use the drag-and-drop method or double-click to use the algorithm in the canvas. Click the algorithm to view and select different properties for analysis. You can access it using the search option.
Properties of One Sample Proportion Test
The available properties of the One Sample Proportion Test are shown below.
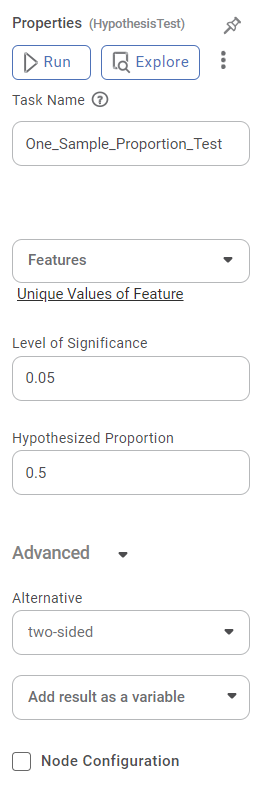
The table below describes the different properties of the One Sample Proportion Test.
Field | Description | Remark | |
|---|---|---|---|
| Run | It allows you to run the node. | - | |
| Explore | It allows you to explore the successfully executed node. | - | |
| Vertical Ellipses | The available options are
| - | |
Task Name
| It is the name of the task selected on the workbook canvas. |
| |
Features
| It allows you to select the categorical values. |
| |
Unique Values of Features
| It allows you to select the unique values within the features. |
| |
Level of Significance
| It allows you to set the level of significance. |
| |
Hypothesized Proportion
| It allows you to set the Hypothesized Value |
| |
Advanced | Alternative | Defines the alternative hypothesis. |
|
Node Configuration | It allows you to select the instance of the AWS server to provide control over the execution of a task in a workbook or workflow. | For more details, refer to Worker Node Configuration. | |
Example of One Sample Proportion Test
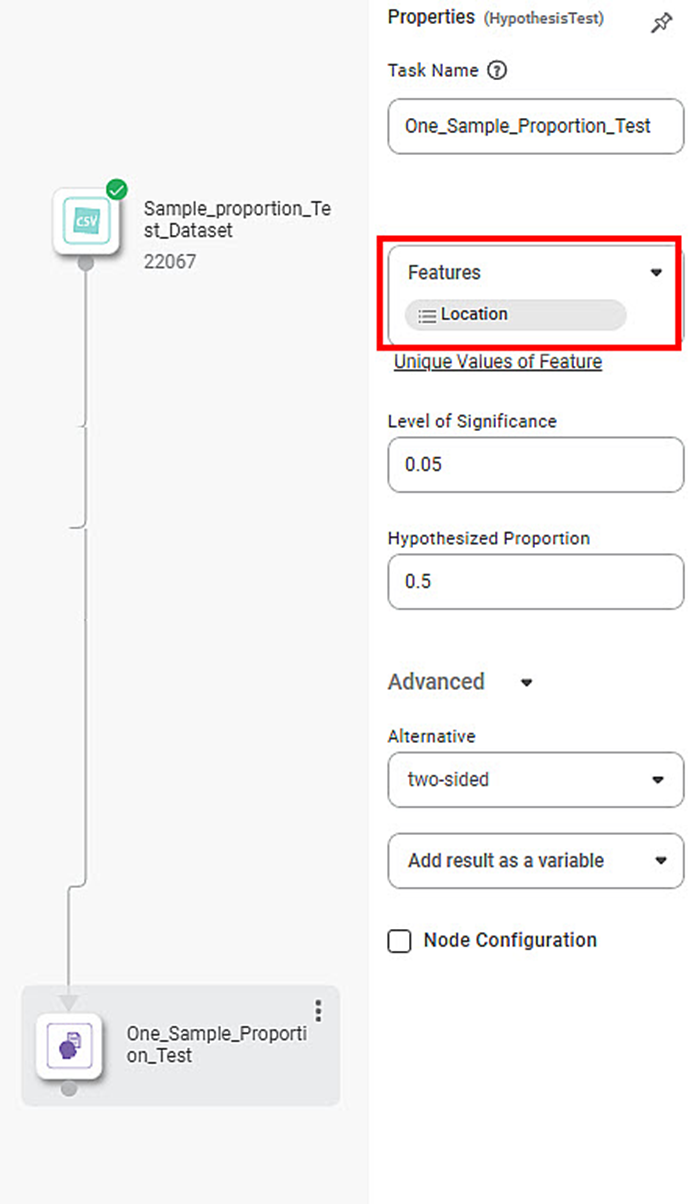
Consider a dataset containing features like Customer Id, Age, Occupation, Current Balance, Current Month Credit, Current Month Debit, Current Month Balance, Location, and so on.
Location is selected as a feature for the categorical variable.
To add a Unique Value of Feature, follow the steps given below.
- Click on the Unique Value of Feature in the properties pane. The output Column window is shown.
- Click Add all unique value. The unique values within the selected feature are shown in the values drop-down option.
- In value, select the required unique value from the drop-down list.
- Click Done.
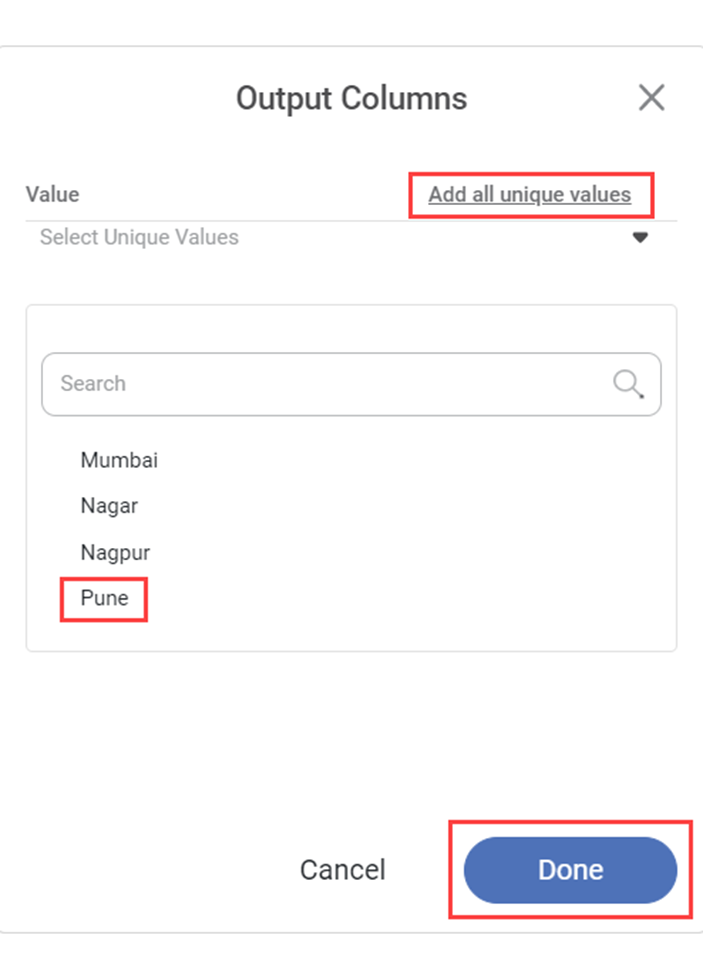
Here, Pune is selected as the Unique Value of the Feature.
Click the vertical ellipsis ( ![]() ) and run the node. After the running status is updated click explore to view the test result.
) and run the node. After the running status is updated click explore to view the test result.
The part of the result page for the One Sample Proportion Test is displayed below.
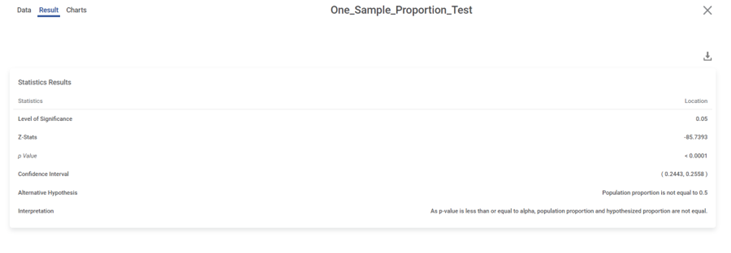
The Statistical Results section displays One Sample Proportion Test results. It shows the value of the following parameters.
- Level of Significance
- Z- Status
- p-value
- Confidence Interval
- Alternative Hypothesis
- Interpretation
Related Articles
One Sample Z Test
One sample Z Test is located under Model Studio > Statistical Analysis > One Sample z-test on the left task pane. Use the drag-and-drop method (or double-click on the node) to use the algorithm in the canvas. Click the algorithm to view and select ...One Sample T Test
One Sample t Test is located under Model Studio > Statistical Analysis > One sample t Test. Use the drag-and-drop method (or double-click on the node) to use the algorithm in the canvas. Then, Click the algorithm to view and select different ...One Sample Wilcoxon Signed Rank Test
One Sample Wilcoxon Signed Rank Test is located under Model Studio () in Statistical Analysis below Hypothesis Test, under Non-Parametric Test in the left task pane. Use the drag-and-drop method or double-click to use the algorithm in the canvas. ...Two Sample Z Test
Two Sample Z Test Description Two sample Z test is a statistical test used to determine whether there is a significant difference between the means of two independent variables. Why to use To compare the means of two independent variables When to use ...One Way ANOVA
One Way ANOVA is located under Model Studio ( ) in ANOVA Analysis under Statistical Analysis, in the task pane on the left. Use the drag-and-drop method to use the algorithm in the canvas. Click the algorithm to view and select different properties ...