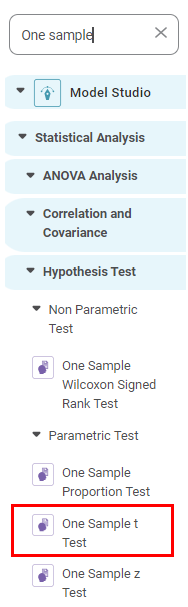
One Sample T Test
One Sample t Test is located under Model Studio > Statistical Analysis > One sample t Test.
Use the drag-and-drop method (or double-click on the node) to use the algorithm in the canvas. Then, Click the algorithm to view and select different properties for analysis.
Properties of One Sample t Test
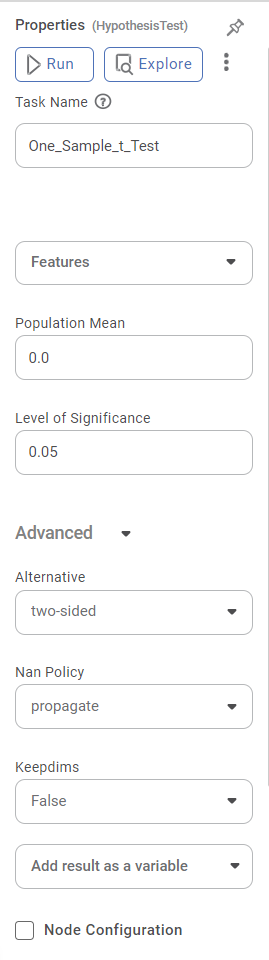
The table below shows the properties of one sample t-test
| Field | Description | Remark |
|---|---|---|
Run | It allows you to run the node. | - |
Explore | It allows you to explore the successfully executed node. | - |
Vertical Ellipses | The available options are
| - |
Task Name | It is the name of the task selected on the workbook canvas. | You can click the text field to edit or modify the task name as required. |
Features | It allows you to select the column for performing the test | Only numerical features can be selected |
Population Mean | It allows you to enter a value for the population mean | - |
Level of Significance | It allows you to enter the alpha value or a significance level |
|
| Advanced | ||
Alternative | It defines the alternative hypothesis |
|
Nan Policy | It defines how to handle nan values |
|
Keepdims | It allows to broadcast the result correctly against the input array. | - |
Example of One Sample t Test
We consider the credit card balance dataset, which includes columns such as Age, balance, cards, and so on.
A snippet of input data is shown below.
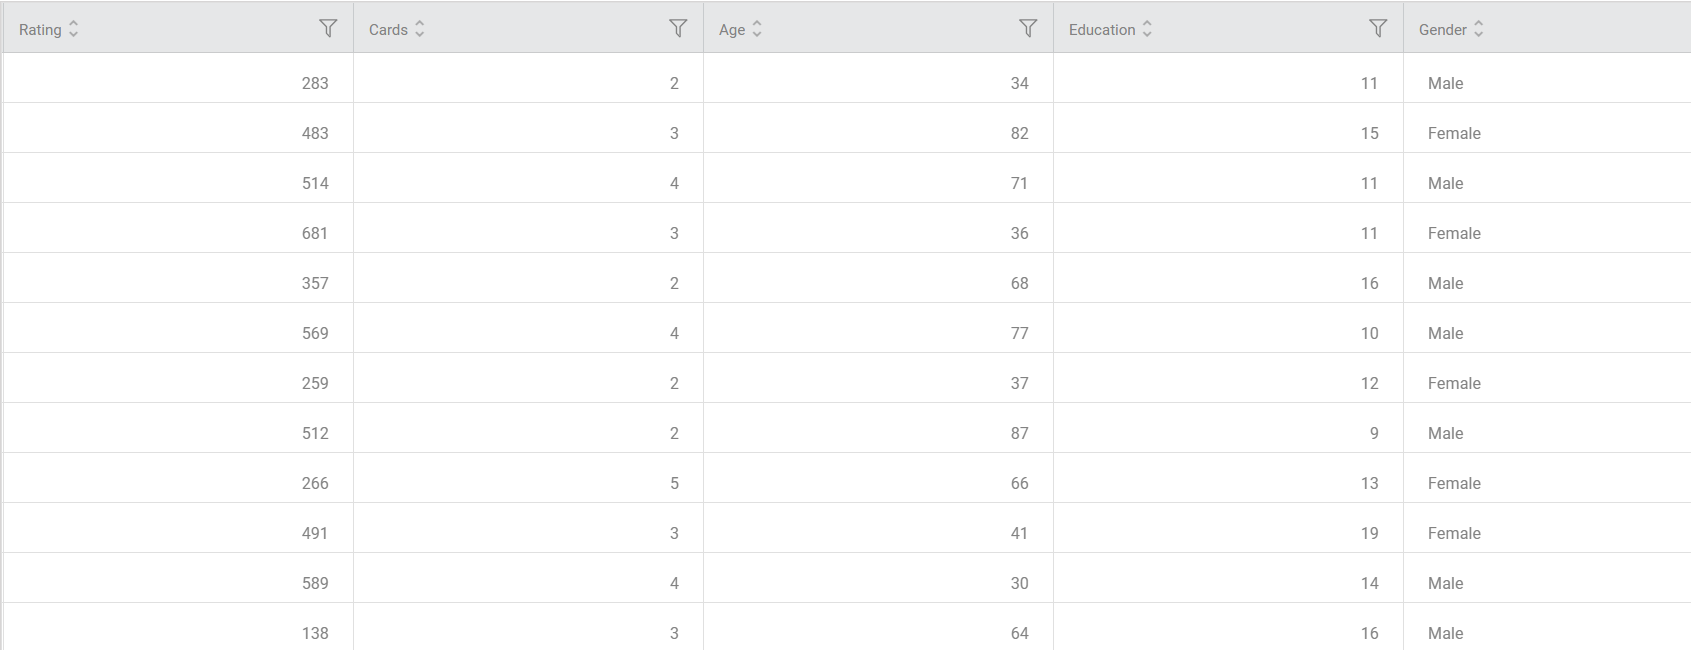
We select Age as the feature and set the population mean to 55.
The result page of one sample t-test is displayed below.
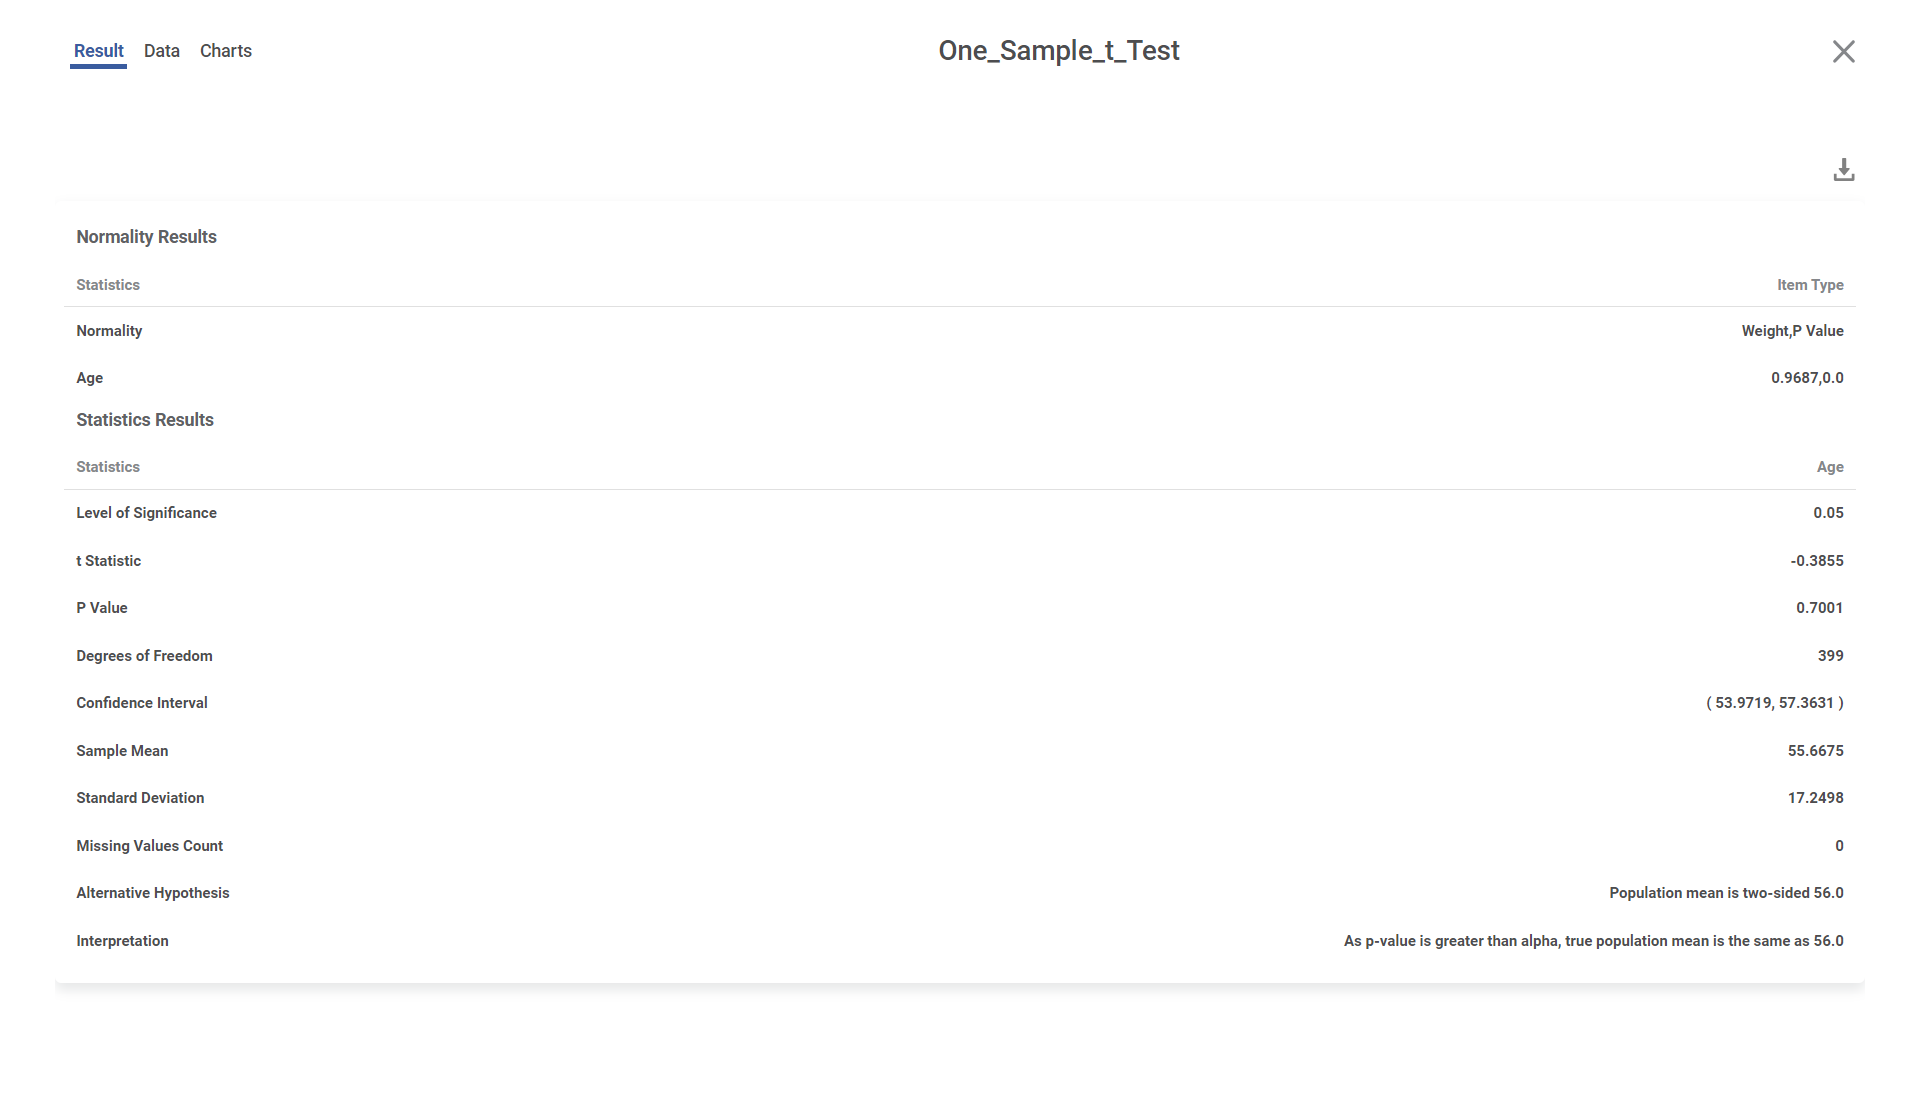
From the above result, we can conclude that the sample mean is equal to the population mean.
Related Articles
One Sample Z Test
One sample Z Test is located under Model Studio > Statistical Analysis > One Sample z-test on the left task pane. Use the drag-and-drop method (or double-click on the node) to use the algorithm in the canvas. Click the algorithm to view and select ...One Sample Proportion Test
One Sample Proportion Test is located under Model Studio in Statistical Analysis below Hypothesis Test, Parametric Test in the left task pane. Use the drag-and-drop method or double-click to use the algorithm in the canvas. Click the algorithm to ...One Sample Wilcoxon Signed Rank Test
One Sample Wilcoxon Signed Rank Test is located under Model Studio () in Statistical Analysis below Hypothesis Test, under Non-Parametric Test in the left task pane. Use the drag-and-drop method or double-click to use the algorithm in the canvas. ...Two Sample Z Test
Two Sample Z Test Description Two sample Z test is a statistical test used to determine whether there is a significant difference between the means of two independent variables. Why to use To compare the means of two independent variables When to use ...One Way ANOVA
One Way ANOVA is located under Model Studio ( ) in ANOVA Analysis under Statistical Analysis, in the task pane on the left. Use the drag-and-drop method to use the algorithm in the canvas. Click the algorithm to view and select different properties ...