Pearson Correlation
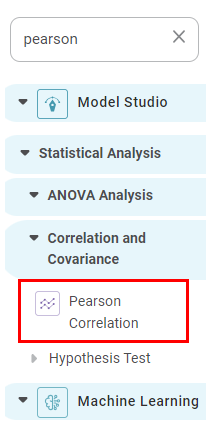
Pearson Correlation is located under Model Studio >> Statistical Analysis >> Correlation and Covariance Alternatively, use the search bar to find the Pearson Correlation feature. Use the drag-and-drop method or double-click to use the algorithm in the canvas. Click the algorithm to view and select different properties for analysis.
Properties of Pearson Correlation
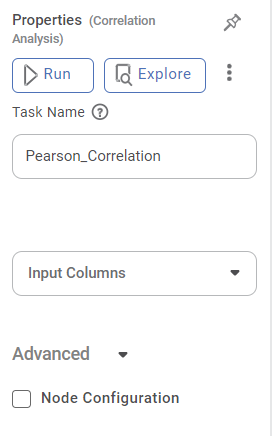
The available properties of the Pearson Correlation are shown in the figure below.
| Field | Description | Remark |
|---|---|---|
| It helps to execute the node. | |
| It helps to explore the successful node. | |
| It displays the following options in the list view.
| |
| Task Name | It is the name of the task selected on the workbook canvas. | You can click the text field to edit or modify the task name as required. |
| Input columns | It refers to the data representing one of the variables being analysed. | You can select two or more Numerical variables. |


Example of Pearson Correlation
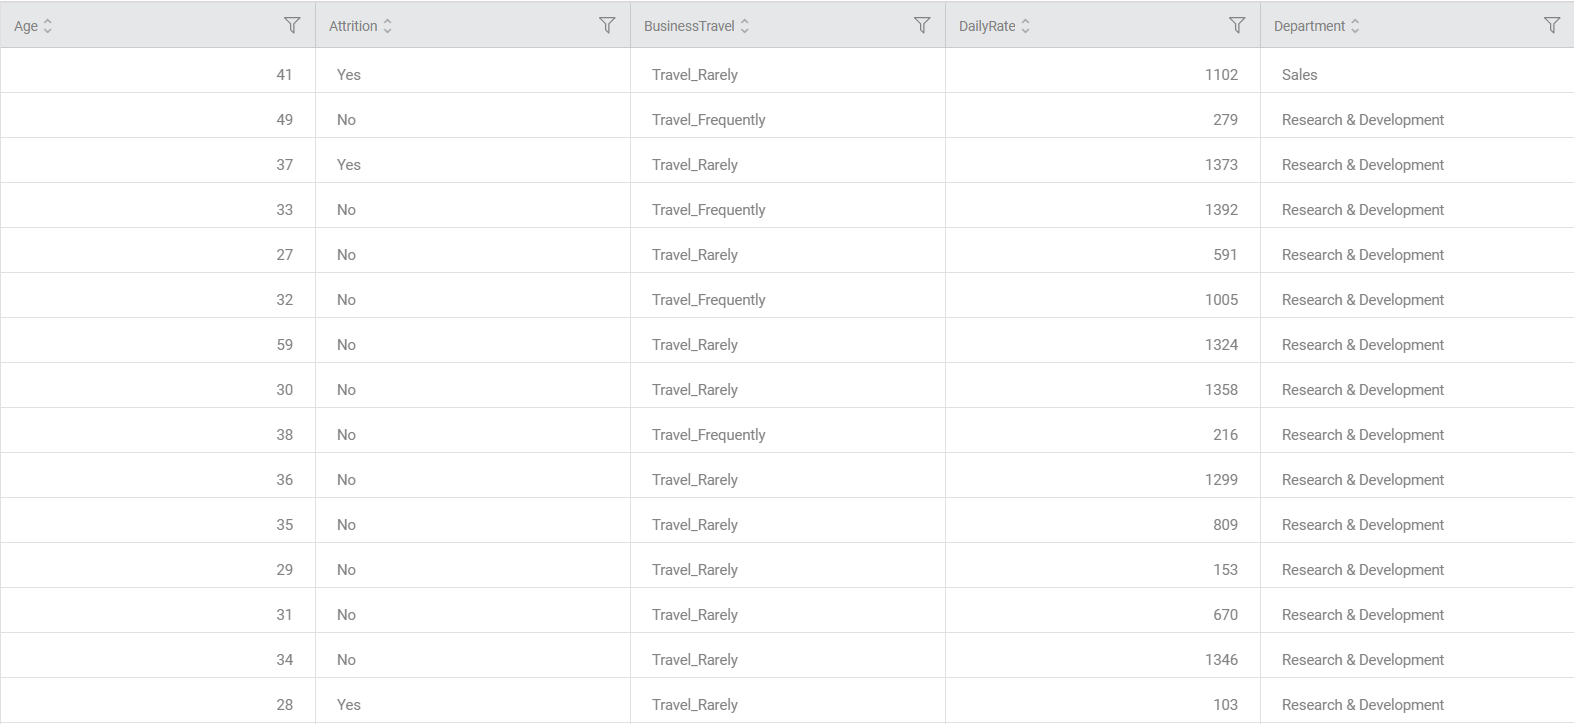
Consider an HR_Employee_Attrition dataset with 1470 records. A snippet of input data is shown below.
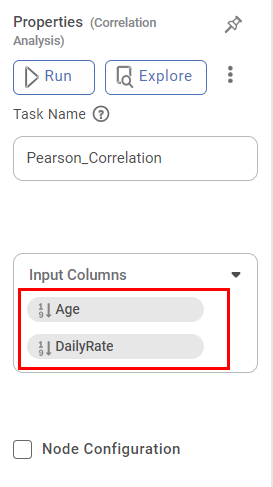
In the Properties pane of Pearson Correlation, the Input Columns are selected as "Age" and "Daily Rate".
The figure below displays the Pearson Correlation output performed on the HR_Employee_Attrition dataset. Here, the input variables are ‘Age’ and ‘DailyRate.
The result is shown below:-
- Correlation Matrix: -
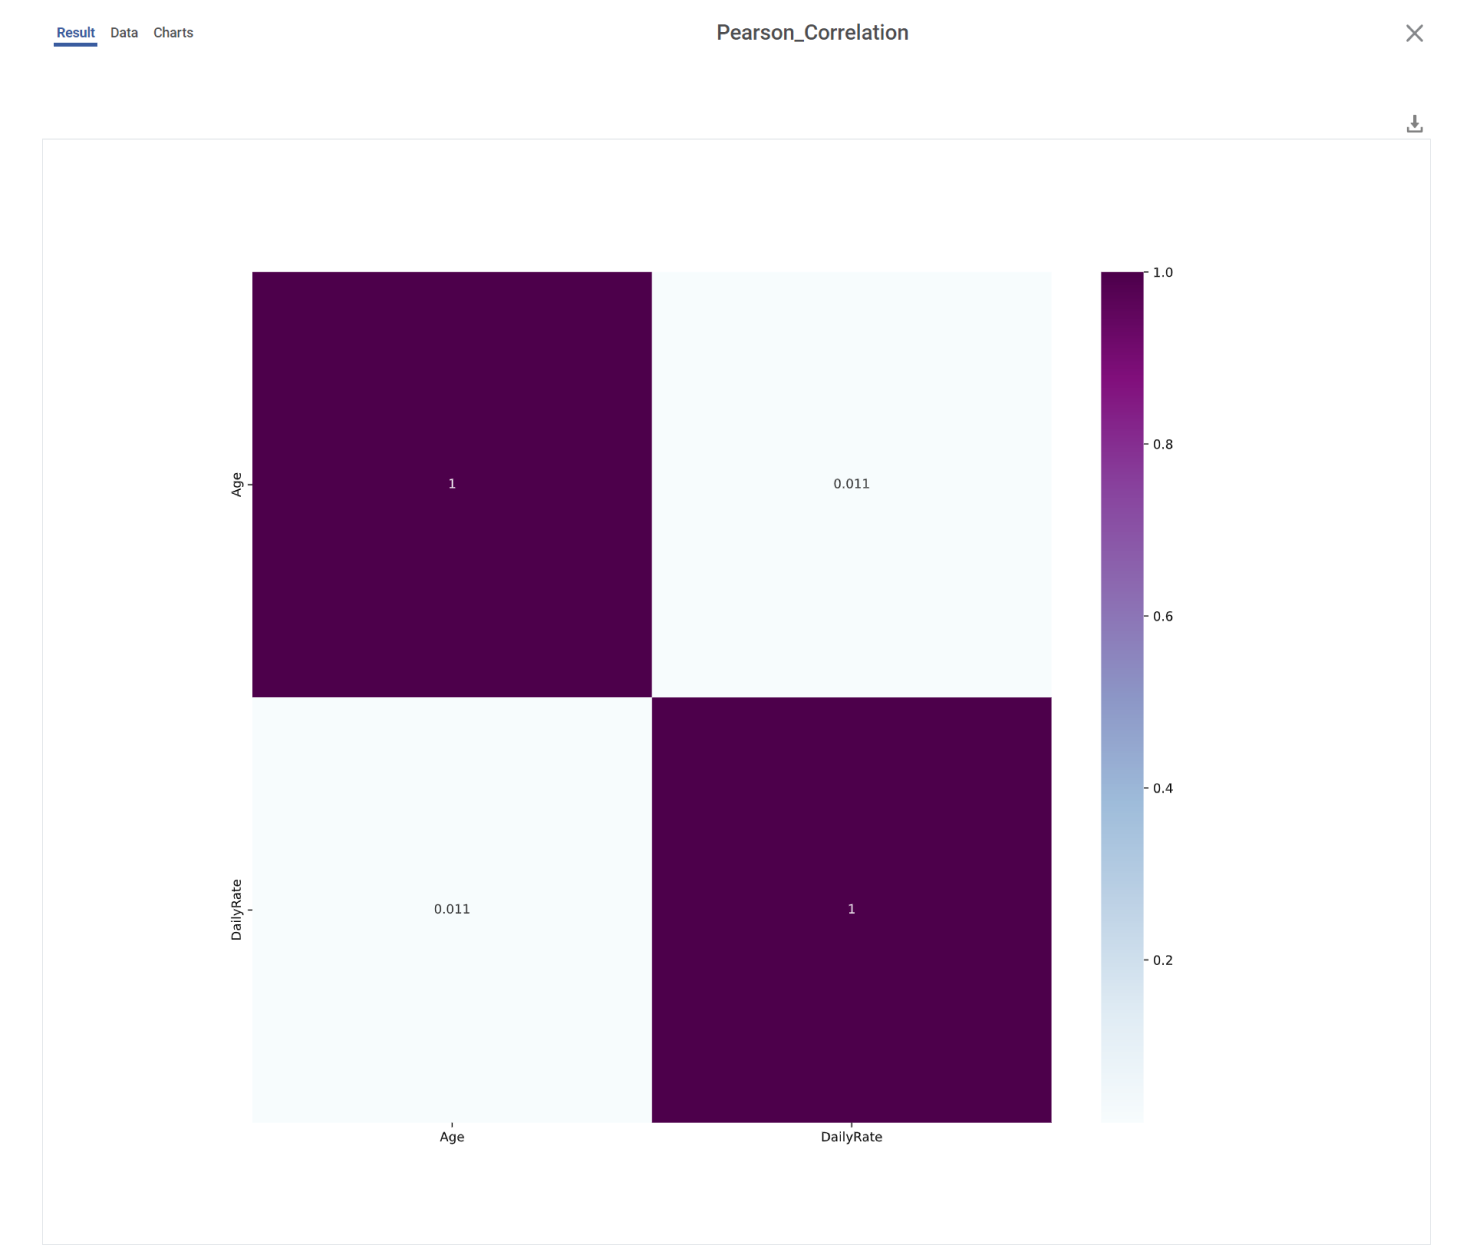
- It gives the correlation score for all the variables.
- A value of correlation scores closer to one (1) indicates a strong correlation between two variables, while a value close to zero (0) indicates a weak correlation.
- Correlation Score Data
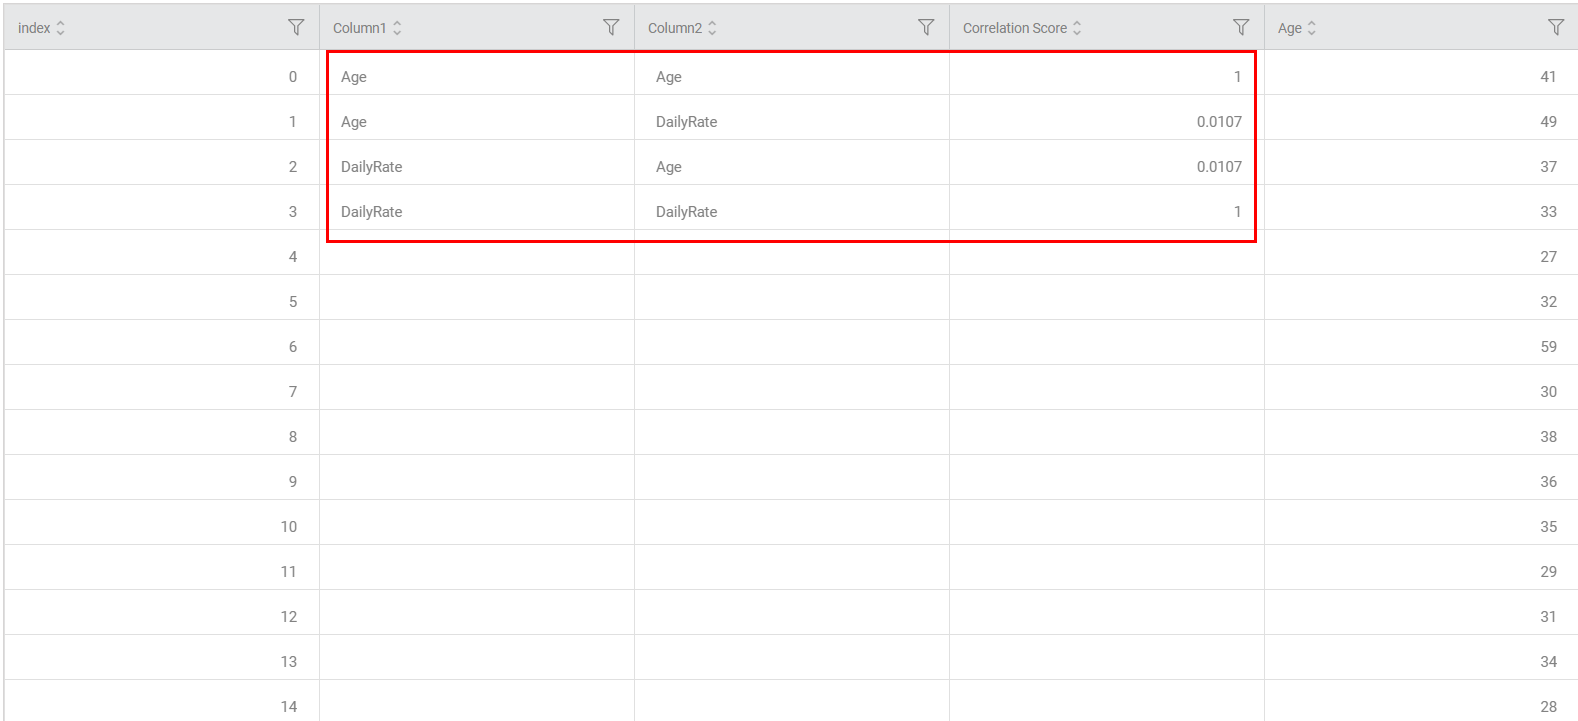
The Pearson correlation results data now includes three new columns: "Column 1," "Column 2," and "Correlation Score." These columns show the selected input column values and the corresponding correlation score.
- It gives the correlation score for all the variables.
- If the number of correlation records are less than the number of input data records, the remaining rows (records) will have "na" data in "Column 1," "Column 2," and "Correlation Score".
Ex: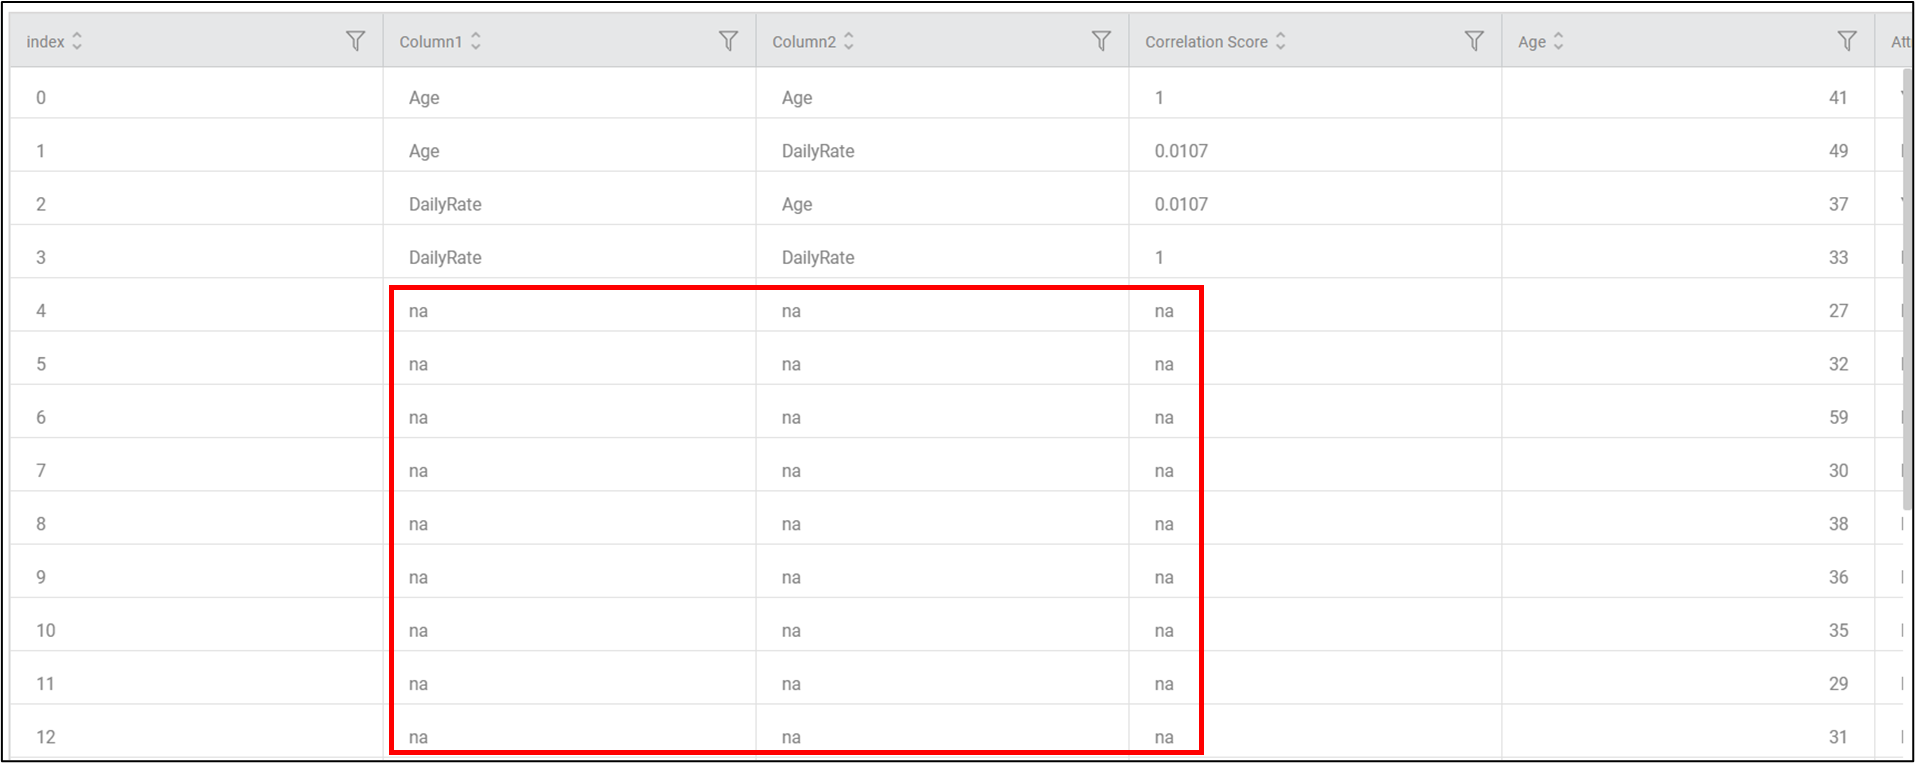
- If there are more correlation values than input data, the data in the input columns for the remaining records will be "na".
Ex: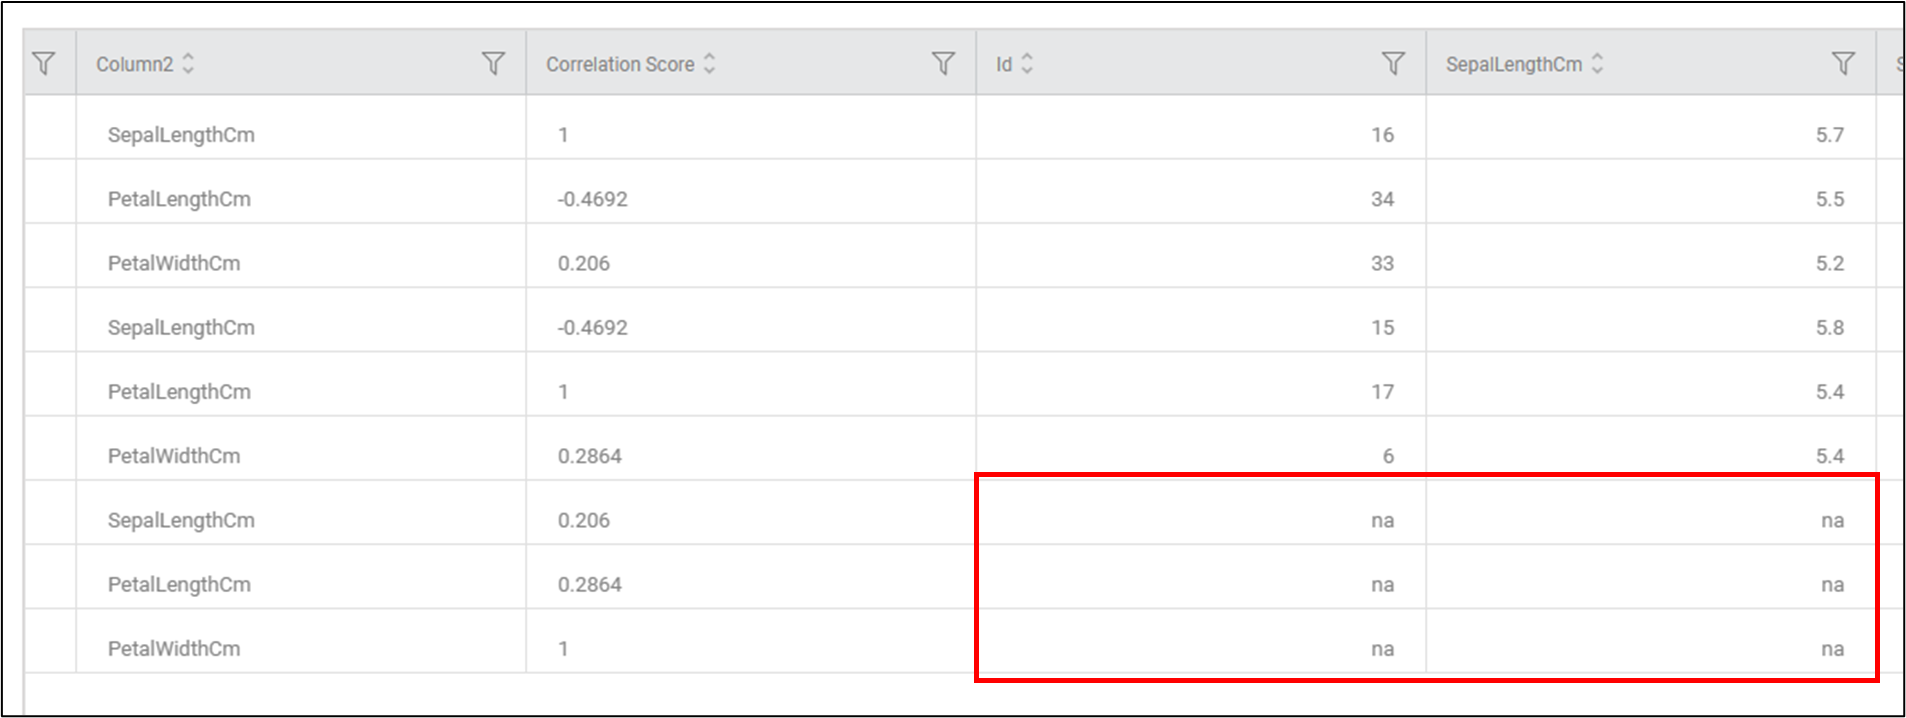
Related Articles
Word Correlation
Word Correlation is located under Textual Analysis in Pre Processing, in the task pane on the left. Use the drag-and-drop method to use the algorithm in the canvas. Click the algorithm to view and select different properties for analysis. Refer to ...Word Correlation
Word Correlation is located under Textual Analysis in Pre Processing, in the task pane on the left. Use the drag-and-drop method to use the algorithm in the canvas. Click the algorithm to view and select different properties for analysis. Refer to ...Factor Analysis
Factor Analysis is located under Model Studio ( ) in Data Preparation, in the left task pane. Use the drag-and-drop method to use the algorithm in the canvas. Click the algorithm to view and select different properties for analysis. Refer to ...Factor Analysis
Factor Analysis is located under Model Studio ( ) in Data Preparation, in the left task pane. Use the drag-and-drop method to use the algorithm in the canvas. Click the algorithm to view and select different properties for analysis. Refer to ...Prompt Studio
Overview Prompt Studio is a Generative AI feature in RubiStudio that allows users to generate insights, summaries, trend analysis, correlation summaries, and smart analysis directly from workbook data. Users configure prompts, select relevant ...