Percentage Calculations
For widgets like pie charts and donut charts, it is sometimes required to display the values as a percentage of the share of each section in the total share. For this, Rubiscape provides a Percentage functionality alongside the Aggregation methods to display the values on the tooltip as percentages.
Let's plot a pie chart of the Sales by Category as an example.
If you hover over any section, its actual Sales value is displayed. For example, the Technology Sales is 836154.03. This is the Technology share out of the total Sales of Technology, Furniture, and Office Supplies.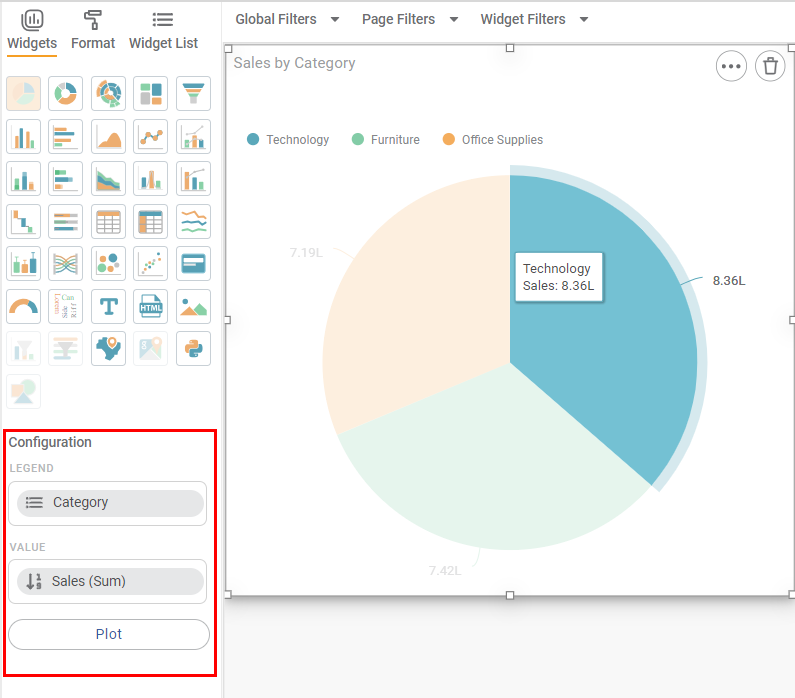
Now, we want to express each share as a percentage to understand the contribution of each Category to the total Sales.
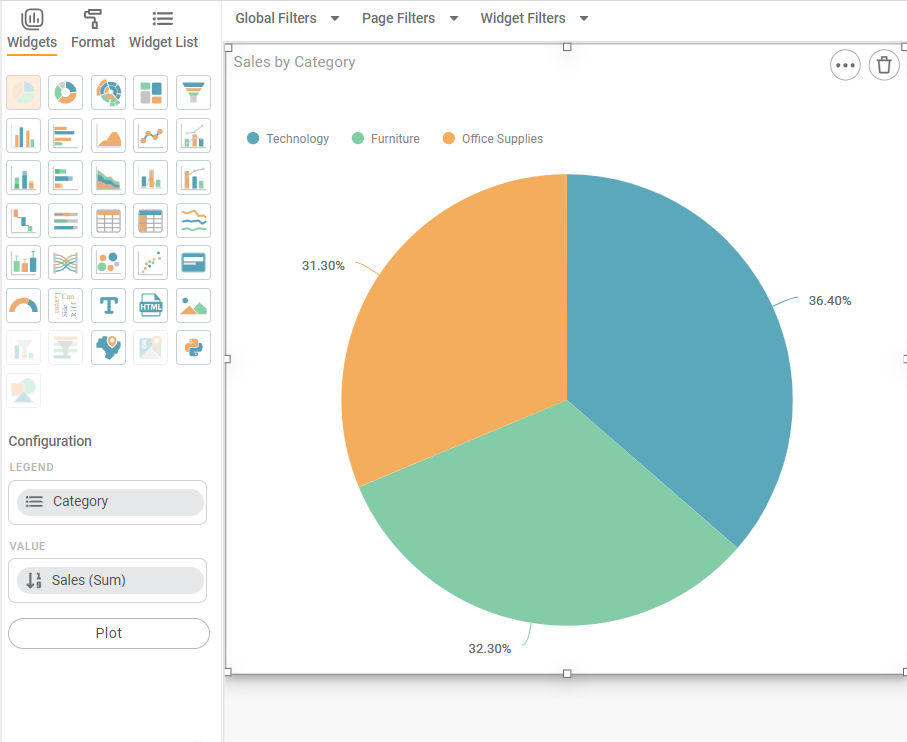
In configuration pane, hover over Sales, click the gear icon (![]() ), select the Percentage checkbox, and click Plot.
), select the Percentage checkbox, and click Plot.
You see that the Sales values are now expressed as a percentage. For example, the Technology sales contribute to 36.40% of the total sales.
Related Articles
Dynamic Calculations
Dynamic Calculations is a part of the Expression function. Using Dynamic Calculations, you can define formulas to create new features from the existing features of the dataset. Dynamic Calculations is one of the features available in the Expression ...Calculated Columns in RubiSight
RubiSight provides a function to add a new column that is not originally present in your dataset. You can create a new column by doing some calculations on the existing columns. RubiSight uses the Expression function for creating a new column using ...Number Format
Number Formatting allows you to change the way numerical entities appear on the X and Y-axes. It is applicable for features under Measures (numerical variables). The figure below shows the available Number Format options. The table given below ...Contextual Data Tooltips
Tooltip configuration allows you to display additional information from the source dataset that is not directly plotted on the chart. This enhances data visibility by providing contextual insights when users hover over chart elements. Overview ...Expression
Expression is located under Model Studio ( ) in Data Preparation, in the Task Pane on the left. Use the drag-and-drop method to use the feature in the canvas. Click the feature to view and select different properties for analysis. Refer to Properties ...