Raw Data
Follow the following steps to view the raw data.
- Click on the Things menu. It displays all the Active and Inactive things.
- Click on the active thing to display the Things details. On this page, you will see the Raw Data option.When you click on the Raw Data option, it displays the page as the figure below.
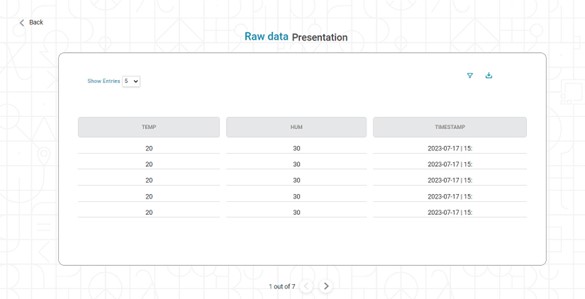 You can perform several operations like Download, Filter, and Show entries.
- Show entries: This dropdown decides the number of entries displayed per page. The default option is 5. However, you can change it to 10, 25, 50, and 100.
- Filter: Apply the filter by clicking on the filter (
 ) icon. You will see the following popup.
- The following fields are applicable for filter criteria.
- Time Interval: You must enter the From Date and To Date for filtering. The system selects data between this From Date and To Date.
- Select Columns: This dropdown consists of all columns. You select the columns that you want to see on the main screen.
- Click on Apply, it applies the filter criteria to the table data.
- Download: When you click the download (
 ) button, it downloads the data in CSV format.
Related Articles
Data Compare
Data Compare is located under Model Studio ( ) in Data Preparation, in the task pane on the left. Use the drag-and-drop method to use the algorithm in the canvas. Click the algorithm to view and select different properties for analysis. In the Data ...Live Data
Data visualization is the representation of data in the form of pictures, images, graphs, or any other form of visual illustration. In RubiThings, Live Data is visualized in the form of Line Chart, SolidGauge, and Speedometer. To fetch the live data, ...Data Merge
Data Merge is located under Model Studio ( ) in Data Preparation, in the task pane on the left. Use drag-and-drop method to use the algorithm in the canvas. Click the algorithm to view and select different properties for analysis. Properties of Data ...Data Merge
Data Merge is located under Model Studio ( ) in Data Preparation, in the task pane on the left. Use drag-and-drop method to use the algorithm in the canvas. Click the algorithm to view and select different properties for analysis. Properties of Data ...Data Preparation
Time-series Data Preparation organizes and formats transactional data into time-series data to predict trends and seasonality in the data. Transactional data is timestamped data recorded over a period at no specific frequency, while time-series data ...