Search Option In Filter Widget
In RubiSight, a Filter Widget filters data present in other widgets on the same dashboard page. Usually, a categorical feature is used to plot a filter widget.
When you plot a filter widget, the values appear on the filter widget in the form of
- List
- Dropdown
- Button
- Toggle Button

If the number of values is large, you need to scroll down the list to find the appropriate value.
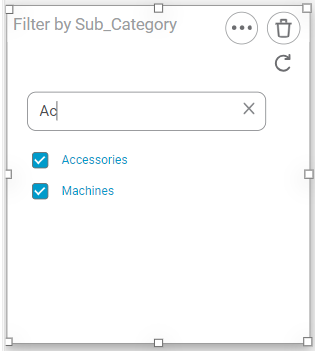
Instead, you can use the Search Field to search for a value of your choice. The Search Field is not case-sensitive. You can search using any of the following text strings
- Single letter
- Group of letters
- Complete name
In the example below, a search string 'ac' returns two search results, Accessories and Machines.

Notes: |
|
Related Articles
Search Option in Data Pane
When creating dashboards, we add datasets to them to plot various widgets. To plot widgets, multiple datasets can be used on the same dashboard page, or the same dataset can be used on multiple dashboard pages. All these datasets are parked in the ...Widget Filter
Widget filters are activated when we click on a particular widget; that is, they are applied only to the selected widget. To apply widget filters, follow the steps given below. Create the number of charts as required. Refer to Creating Charts using ...Page Filter
The Page Filter option is always available on the filter pane of the Dashboard canvas. The page filters apply to all the charts plotted on a page of the Dashboard. To apply a Page Filter, follow the steps given below. Create the number of charts as ...User Defined Widget Name
The Widget Name Formatter allows users to assign meaningful, custom names to widgets across all chart and widget types in RubiSight dashboards. This helps in easy identification of widgets during interactions such as filtering, interactivity control, ...Generate Widget Level Insights
Widget-Level Insights (Narration) The RubiAI Widget-Level Narration feature enables AI-generated summaries specific to each individual widget. This allows users to derive insights based on the data visualized in a single chart or graph, considering ...