Sentiment Colors
The Sentiment Colors formatting option is available in the Waterfall chart. It allows you to select the colors for the increasing, decreasing, and total values.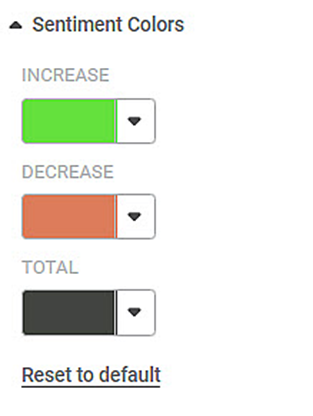
The table given below describes different fields present for Sentiment Colors formatting.
Field | Description | Remark |
|---|---|---|
Increase | It allows you to select a suitable color for the bricks that represent a gradual increase in value. |
|
Decrease | It allows you to select a suitable color for the bricks that represent a gradual decrease in value. | |
Total | It allows you to select a suitable color for the column that represents the total value of all the bricks. | — |
To use Sentiment Colors formatting options, first plot a Waterfall Chart using the dimensions and measures from the dataset.
For example, we plot a Waterfall Chart of Education against Ethnicity.
The figure given below shows an original image of the Waterfall Chart.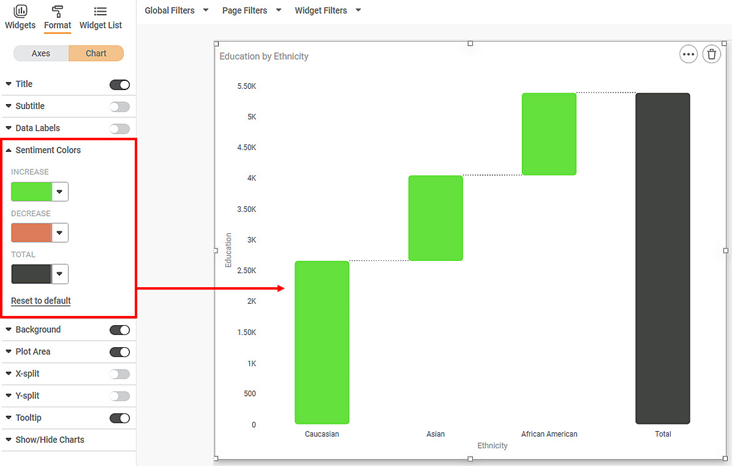
Now, Change the sentiment colors.
The resultant widget is shown below.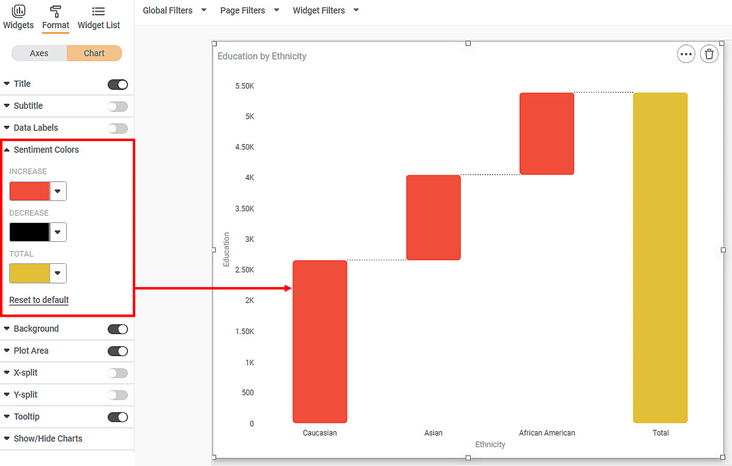
Related Articles
Sentiment
Sentiment analysis is done using algorithms that use text analysis and natural language processing to classify words as either positive, negative, or neutral. It is done using Positive or Negative Lexicons. A sentiment score is derived depending on ...Basic Sentiment Analysis
Basic Sentiment Analysis is located under Textual Analysis ( ) in Sentiment, in the task pane on the left. Use drag-and-drop method to use algorithm in the canvas. Click the algorithm to view and select different properties for analysis. Refer to ...Basic Sentiment Analysis
Basic Sentiment Analysis is located under Textual Analysis ( ) in Sentiment, in the task pane on the left. Use drag-and-drop method to use algorithm in the canvas. Click the algorithm to view and select different properties for analysis. Refer to ...Data Color
Data Color formatting option allows you to select the color of the data displayed on the chart. The table given below describes different fields present on Data Color formatting. Field Description Remark Default Color It allows you to select the ...Twitter
Rubiscape provides the functionality to create a dataset using Twitter data. On this data, you can perform Twitter Sentiment Analysis using the text processing algorithms provided in Text Analytics. The sentiment analysis helps to determine the tone ...