Show blank as zero
Showing blanks as zero in widgets
Show Blank as Zero functionality allows you to represent Null values as zero in widgets. It is available in line chart, column chart, bar chart, stacked bar chart, stacked column chart and Combination chart.
By default, the Show Blank as Zero functionality is visible.
Aggregation Methods
For Count and Count Distinct aggregation methods, Null values are not considered.
Consider the following example.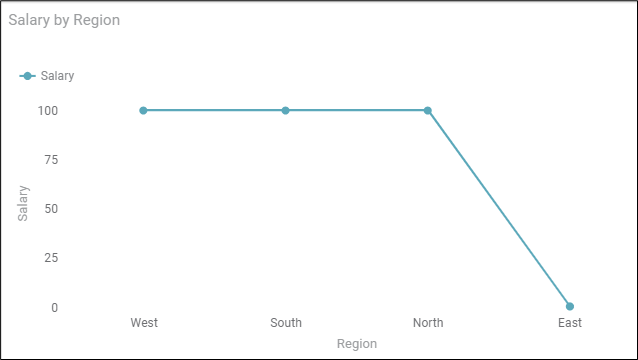
In the above example, we plot a line chart of Salary against Region. By default, Show Blank as zero is enabled. Since there are null values for Salary in the East Region, these null values are represented as 0.
If we turn off the show blank as zero toggle button, the chart will change to the following result.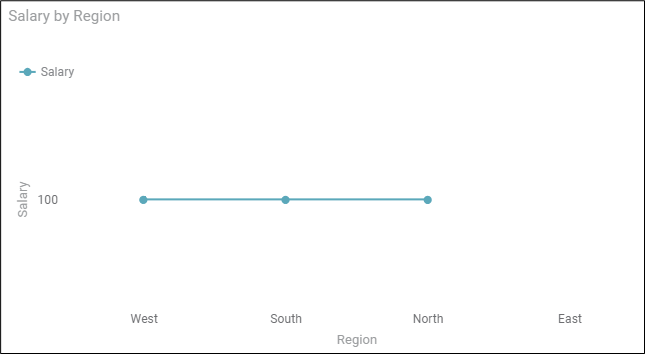
Here, since there is no salary for the East region, nothing is plotted for the East Region.
Show Null values as blanks in Filter widget.
In Filter widget, the null values are represented by <BLANK>. if we apply filter on numerical column we will exclude nan from It and only consider given range by filter.
Date Filter with NAT Values
- Between Option:
- NAT values will be visible in the result
- If the Min and Max values are the same, NAT values will not be visible
- Before and After Options:
- NAT Values will be visible
- In Last Option:
- NAT values will not be visible
Consider the following example.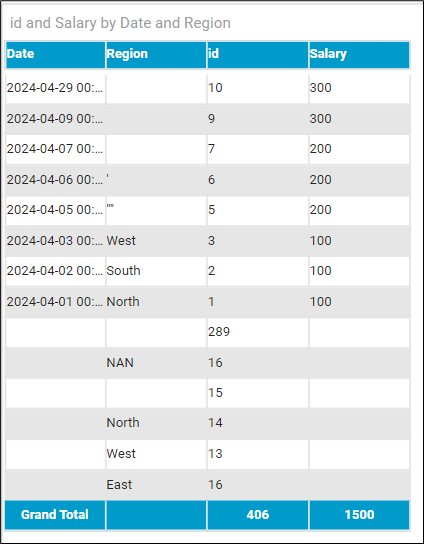
You can filter the null values using filter widget. These null values are represented as <BLANK>.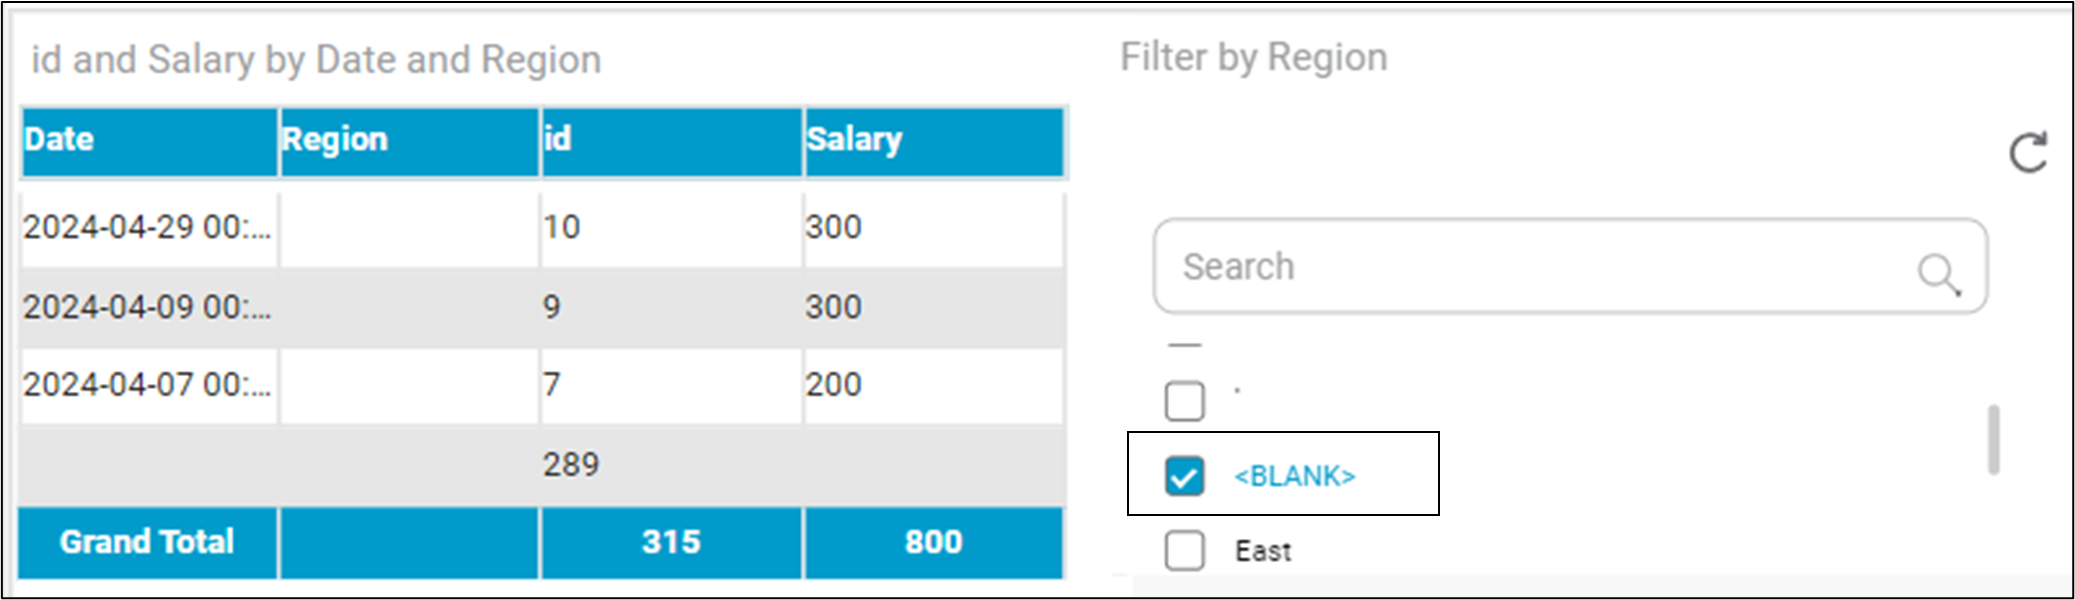
In the above example we have filtered the region column with blank category.
Related Articles
Show Hide Charts
You can hide a widget if it is not required to be displayed on the dashboard for any reason. The multiple scenarios for using this functionality are given below. Scenario 1: Show/Hide a Chart Manually For hiding a widget manually, click Widget List, ...Show Hide Page in Rubisight Dashboard
1. Overview • The Show / Hide Page feature allows users to control page visibility within a dashboard. • This is useful for restricting access, staging content, or simplifying navigation. 2. Default Behavior • All newly created dashboard pages ...User Defined Widget Name
The Widget Name Formatter allows users to assign meaningful, custom names to widgets across all chart and widget types in RubiSight dashboards. This helps in easy identification of widgets during interactions such as filtering, interactivity control, ...Widget List
The Widget List option is present in the Widget pane, next to Widgets and Format tabs. The Widget List is used to display the list of plotted widgets on a Dashboard page in a particular sequence. The last plotted widget appears first in the list, ...Combined Data Cleansing
Combined Data Cleansing is located under Model Studio ( ) in Data Preparation, in the left task pane. Use the drag-and-drop method to use the algorithm in the canvas. Click the algorithm to view and select different properties for analysis. Refer to ...