Spline
The Spline formatting option is available in the Line chart.
You can use the Spline function to draw smooth curves (instead of straight lines) connecting the data points of the graph.
By default, the spline option is off. Turn the toggle button ON () to use the spline option.
To use the Spline formatting option, first plot a Line Chart using the dimensions and measures from the dataset. For example, we plot a Line Chart of the Income against Gender. The Ethnicity of the sample is the Legend dimension.
The figure given below shows an original image of the Line Chart. By default, Spline is off.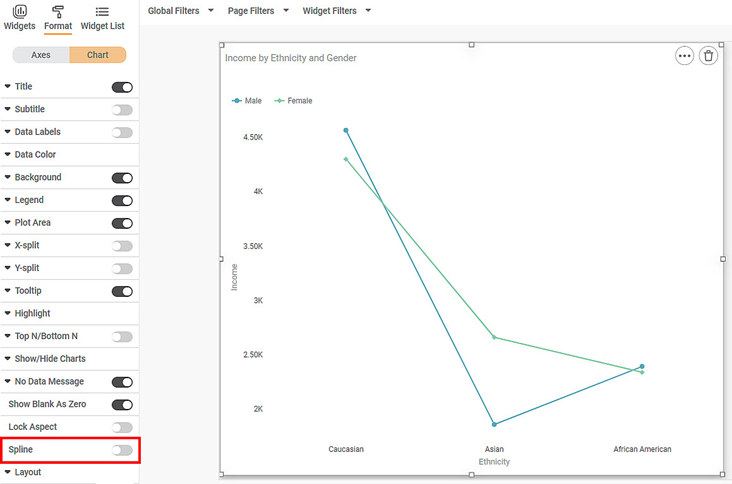
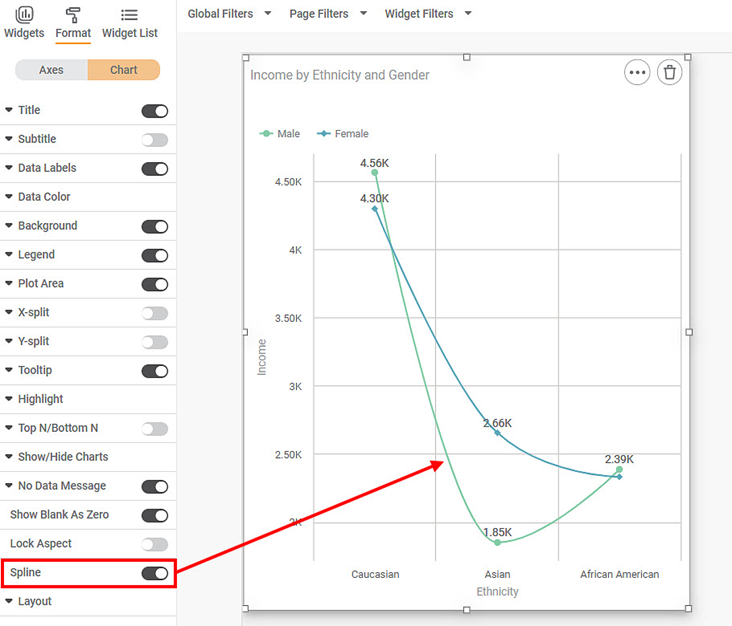
Now, we turn Spline ON. The resultant widget is shown below.
Related Articles
Plot Type
The Plot Type formatting option is available in the Combination Chart. The table given below describes different fields present for Plot Type formatting. Field Description Remark Column Organization of data in the column. The values are: CLUSTER – ...