Stepped Layout
In RubiSight, you can plot a Cross Table using multiple features from the dataset. A Cross Table contains the following configuration options.
- Rows
- Columns
- Values
The Stepped Layout option is available under Row in Cross Table formatting options.
Stepped Layout is used to convert a list of data field values in a feature into a drop-down.
To view the effect of the Stepped Layout formatting option, first plot a Cross Table using dimensions and measures from the Superstore dataset.
Note: | By default, the Stepped Layout toggle button is OFF, that is, disabled. |
In the example below, we plot a Cross Table by selecting
- Married and Gender as Row variables
- Ethinicity as the Column variable
- Income(Average) and Cards(Average) as Value variables
The figure below shows the widget with the Formatting view.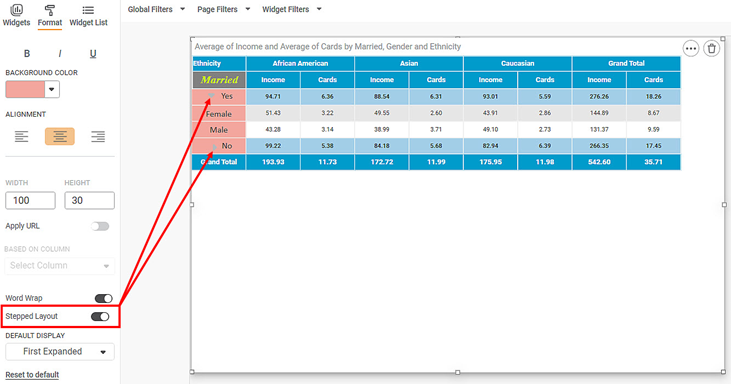
Observations:
In the above Cross Table,
- By default,
- Row variables are displayed as the row headers
- Ethinicity variable is displayed as main column header
- Value variables are displayed as second-level column headers
- The Married values are displayed as row header in the first Column.
- The Gender values are displayed as row header in the Second Column.
To view the impact of enabling the Stepped Layout toggle button, follow the steps given below.
- Click Format in the widget pane.
You notice that the Stepped Layout toggle button is OFF, that is, disabled. - Now click the toggle button to enable it.
The appearance of the Cross Table changes.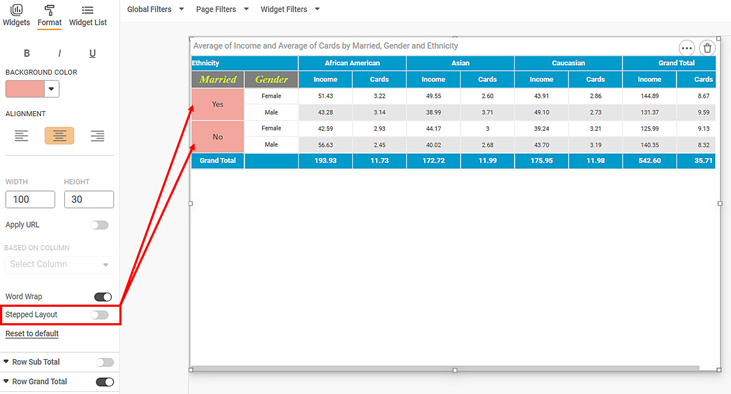
Observations:
In the above Cross Table,
- The Ethinicity headers are displayed as Column heading in the first Column.
- The Gender values are displayed as a drop-down list in the first Column. It makes the Cross Table appear compact. As required, you can click the drop-down and view the variables.
Related Articles
Layout
Layout refers to the dimensions of that portion of the canvas on which the Chart is plotted. These dimensions can be changed and adjusted as required. Here, the canvas size remains the same. The Layout formatting option is available in the Chart ...Layout
When you plot a widget, the widget appears on the dashboard canvas within a page with default dimensions. The width and height of the page within the boundaries of the dashboard canvas define the Page Type. You can view the Page Type under Page Size ...Introduction to Mobile View
Refer Navigate Mobile View to access the Mobile View. To ensure your dashboard is displayed correctly in the RubiSight Mobile Application, you need to configure the Mobile View. Charts can be organized in any desired layout, independent of the layout ...Configuring Dashboard from Mobile View
Refer Navigate Mobile View to access the Mobile View. Refer Mobile View introduction for getting details of the sections available in the Mobile View and why this configuration is required. Navigate to Mobile View of canvas for configuring dashboard ...Line Style
Line Style feature allows you to customize the appearance of the lines in the widgets. It helps you to tailor the visualizations to meet your specific needs and preferences. This feature is available in the following widgets: Line, Pareto, ...