Support Vector Machine in Regression
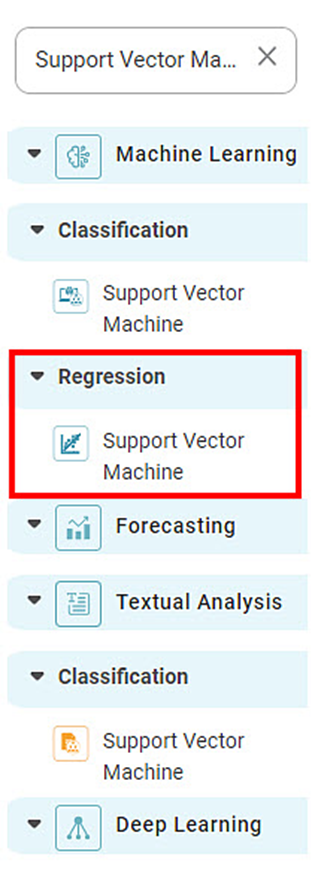
The location of the Support Vector Machine is under Machine Learning in Regression on the feature studio. Alternatively, use the search bar to find Support Vector Machine (SVM) algorithm. Use the drag-and-drop method or double-click to use the algorithm in the canvas. Click the algorithm to view and select different properties for analysis.
Properties of Support Vector Machine
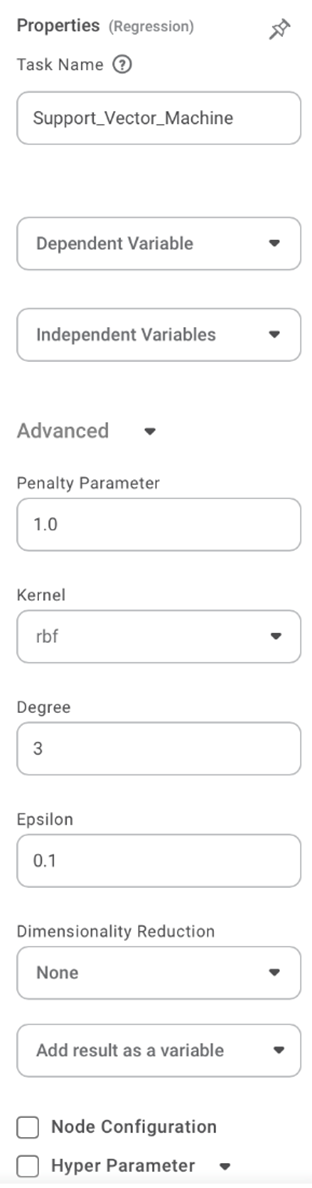
The figure below shows the available properties of the Support Vector Machine:-
The table given below describes the different fields present on the properties of Lasso Regression.
Field | Description | Remark | |
| Run | It allows you to run the node. | - | |
| Explore | It allows you to explore the successfully executed node. | - | |
| Vertical Ellipses | The available options are
| - | |
Task Name | It is the name of the task selected on the workbook canvas. | You can click the text field to edit or modify the task name as required. | |
Dependent Variable | You can select the dependent variable from the drop-down list. |
| |
Independent Variable | It allows you to select the independent variable. | You can choose multiple data fields. | |
Advanced | Penalty Parameter | It allows you to enter the value of the penalty parameter | Consider this as the degree of correct classification that the algorithm must meet. |
Kernel | It allows you to select through various options of kernels. | Different SVM algorithms use different types of kernel functions. | |
Degree | It allows you to select the value of the degree (the default value is 3) | It is the degree of the polynomial function ('poly'), and it ignored by all other kernels | |
Epsilon | It allows you to select the value of the epsilon. | It identifies the region of the epsilon tube where there is no penalty in the training loss function for points predicted to be within the epsilon of the actual value. | |
Example of Support Vector Machine
In the example below, we apply the Support Vector Machine to the Superstore dataset. We select Category, City, Country, etc., as the independent variables, and sales as the dependent variable.
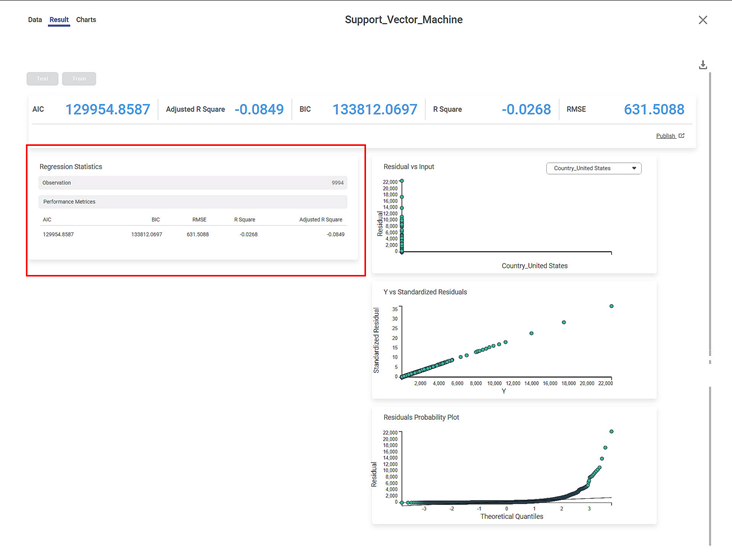
The result page of the Support Vector Machine is displayed below.
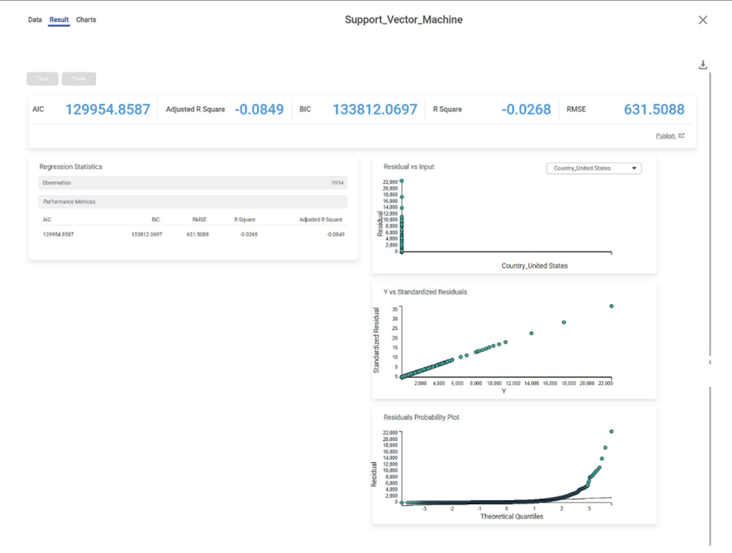
The result page displays the following sections.
- Key Performance Indicator
- Regression Statistics
- Graphical Representation
Section 1 - Key Performance Indicator (KPI)
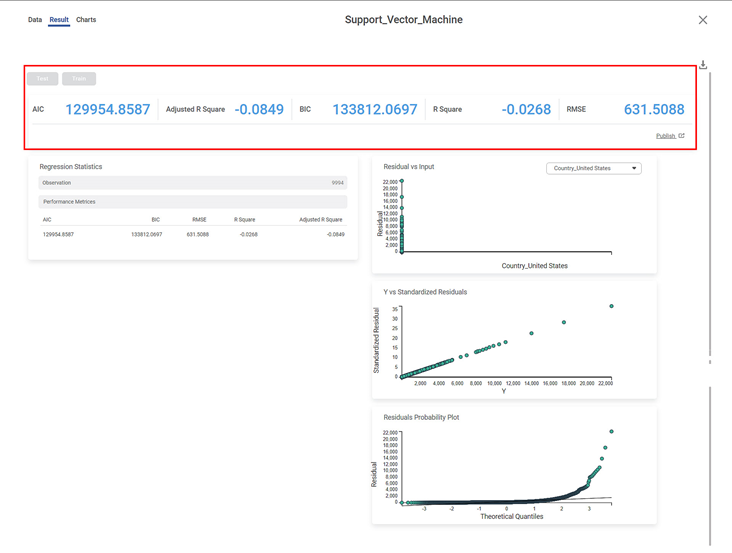
The table below displays various KPIs calculated in Support Vector Machine.
Performance Metric | Description | Remark |
|---|---|---|
RMSE (Root Mean Squared Error) | It is the square root of the averaged squared difference between the actual values and the predicted values. | It is the most commonly used performance metric of the model. |
R Square | It is the statistical measure that determines the proportion of variance in the dependent variable that is explained by the independent variables. | Value is always between 0 and 1. |
Adjusted R Square | It is an improvement of R Square. It adjusts for the increasing predictors and only shows improvement if there is a real improvement. | Adjusted R Square is always lower than R Square. |
AIC (Akaike Information Criterion) | AIC is an estimator of errors in predicted values and signifies the quality of the model for a given dataset. | A model with the least AIC is preferred. |
BIC | BIC is a criterion for model selection amongst a finite set of models. | A model with the least BIC is preferred. |
| MSE (Mean Squared Error) | It is the averaged squared difference between the actual values and the predicted values. | A model with low MSE is preferred. |
| MAE (Mean Absolute Error) | It the absolute value of difference between actual and predicted values | A model with low MAE is preferred. |
| MAPE ( Mean Absolute Percentage Error) | it is the average magnitude of error produced by a model, or how far off predictions are on average. | A model with low MAPE is preferred |
Section 2 – Regression Statistics
The Regression Statistics consist of Observation and Performance metrics.
The Observation displays the total number of rows considered in the Support Vector Machine.
The Performance Matrices consist of all KPI details.
Section 3 – Graphical Representation
Residuals vs inputs
- If this graph creates a pattern, then the sample is improper.
- The graph is plotted with the Independent variable on the x-axis and Residual points on the y-axis.
- On the right side, there is an independent variable dropdown. In this example, independent variables City, Country, and Category appear in the dropdown.
- The input variable is the same as in the dropdown. In the figure below, the input variable is Country, the same as in the dropdown.
- If this graph follows a pattern then the data is not normally distributed.
Y vs. Standardized Residuals
The Y vs. Standardized Residuals graph plots the dependent variable, Sales, on the x-axis and the Standardized Residual on the y-axis.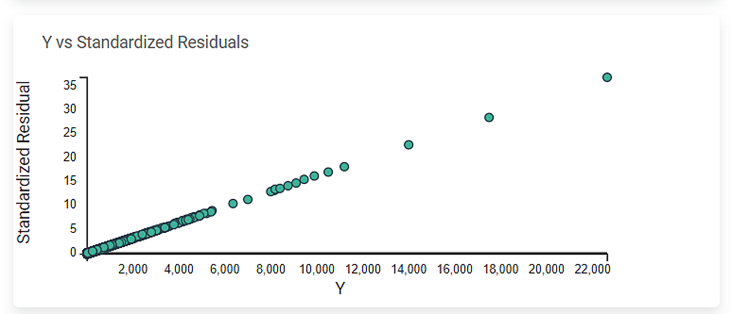
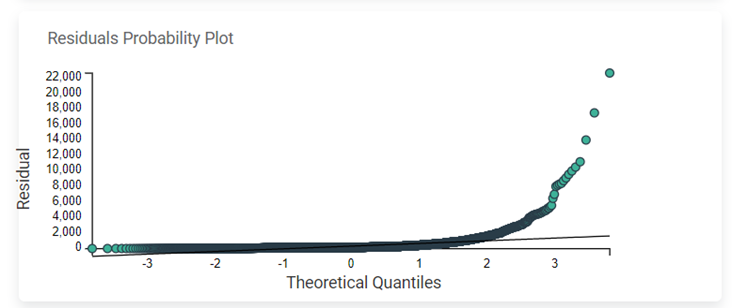
Residuals Probability Plot
The Residuals Probability plot depicts the independent variable on the x-axis and standardized residuals on the y-axis. Its purpose is to identify whether the error terms exhibit a normal distribution.
Related Articles
Task Wise GPU Integration for Machine Learning Algorithms.
Overview GPU execution support has been introduced for supported Machine Learning algorithms to improve processing performance, execution efficiency, and scalability for machine learning workloads. Users can now enable GPU execution at task level for ...Support Vector Machine
Support Vector Machine is located under Textual Analysis ( ) in Classification, in the left task pane. Use the drag-and-drop method to use the algorithm in the canvas. Click the algorithm to view and select different properties for analysis. Refer to ...MLOPS - Machine Learning Operations
Introduction: Why Rubiscape MLOps? Rubiscape MLOps provides an end-to-end environment for building, tracking, publishing, and serving machine learning models. It ensures experiment reproducibility, streamlined deployment, and centralized model ...Classification
Notes: The Reader (Dataset) should be connected to the algorithm. Missing values should not be present in any rows or columns of the reader. To find out missing values in a data, use Descriptive Statistics. Refer to Descriptive Statistics. If missing ...Poisson Regression
Poisson Regression is located under Machine Learning () under Regression, in the left task pane. Use the drag-and-drop method to use the algorithm in the canvas. Click the algorithm to view and select different properties for analysis. Refer to ...