Total And Sub-Totals
No table of figures entries was found.h1. Formatting a Table
You can format the tables that appear in various charts. Tables can be plotted standalone like Table and Cross Table, or they accompany other charts (like Sparkline Chart in which they accompany a Line, Area, or Column Chart). The table formatting options are explained below.
Total
The total displays the Sum of the values for the column. The Total formatting option is available in the Table chart.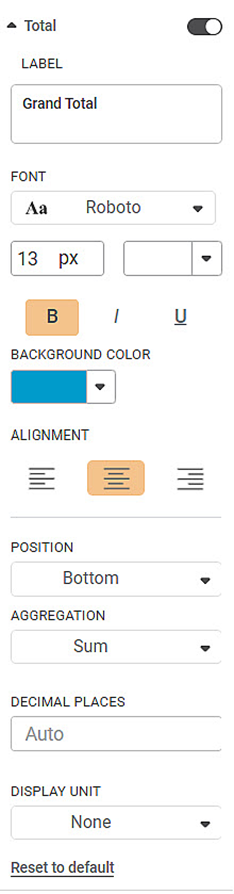
The table given below describes different fields present in Total formatting. These formatting options are applied to label and value.
Field | Description | Remark |
|---|---|---|
Label | It allows you to select the label you want to assign for the Total column. | The default label is Grand Total |
Font | It allows you to change the appearance of the data label. | The default font is Roboto, 13px, Bold, White |
Background Color | It allows you to change the background of the region where the title is displayed. | By default, the color is #DD497E. |
Alignment | It allows you to select the text alignment. | The default is Center alignment. |
Position | It allows you to switch the row position. | You can switch the position to either the Top or Bottom. The default is Bottom. |
Aggregation | It performs the Aggregation function on the column for distinct Dimension. Display the total for the column. | The options are Mean, Minimum, Maximum, and Sum. The default is Sum. |
Decimal Places | It allows you to specify the decimal places for the numeric columns in the Total row. | The default option is Auto. The value starts with 0. |
Display Unit | You are allowed to select the display unit for the numeric columns. | The default option is None. You can select between Thousand and Lakhs. This is generally used for currency. |
Reset to default | When you click this link, all the settings have defaulted. |
First, plot a Table chart using the measures from the dataset to use Total formatting options. For example, we plot a Department, Education, and Age Table. The table with default settings is displayed below.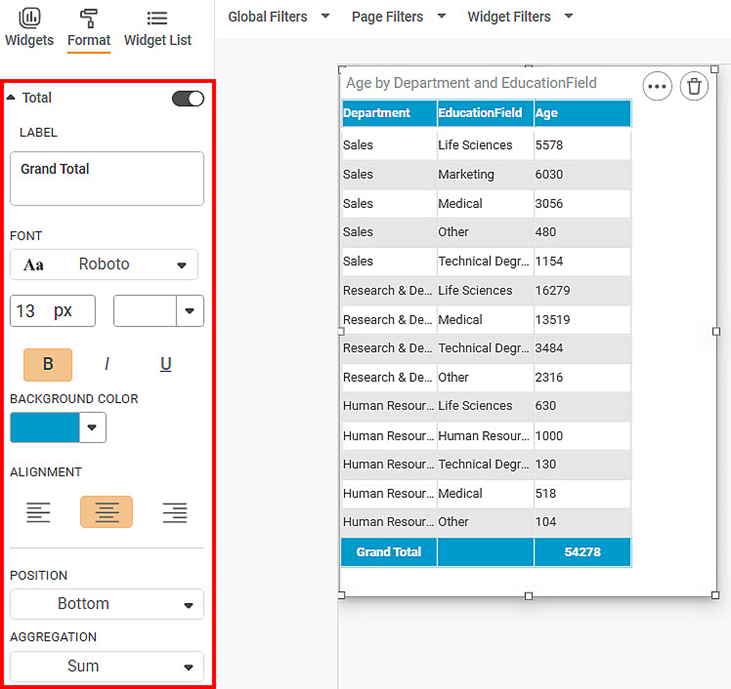
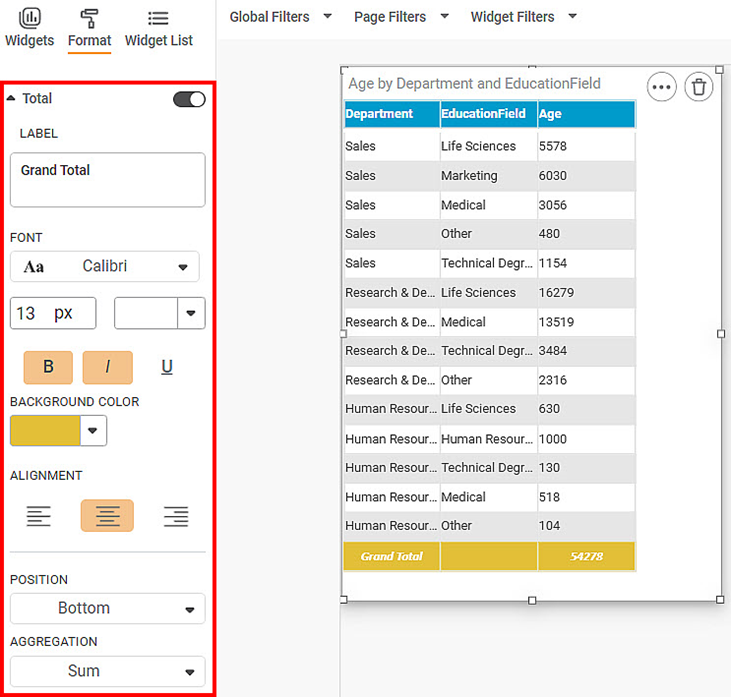
The Figure below displays the overall look and feel after modifying the following options:
- Decimal Places
- Position
- Background color
- Font parameters
Sub Total in Table Widget
You can select more than one dimension in the Table. The Sub Total option is visible whenever there is more than one dimension to the table. The Sub Total option is disabled initially. When you enabled it the Sub Total is displayed. The Sub Total has the following formatting options.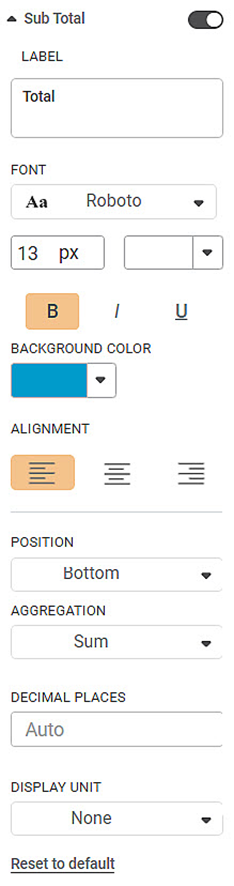
The table given below describes different fields present in Sub Total formatting.
Field | Description | Remark |
|---|---|---|
LABEL | The default | The default value is Total |
FONT | It allows you to change the appearance of the Label and values. | The default font is Roboto, 11px, Bold, #252423 |
BACKGROUND COLOR | It allows you to change the background color of the label Column. | By default, the color is #ffd6e5 |
ALIGNMENT | It allows you to change the text alignment of the label Column. | The default is Left alignment |
POSITION | It allows you to switch the Column position. | You can switch the position to either the Top or Bottom. The default is Bottom. |
AGGREGATION | It performs the Aggregation function on the column for distinct Dimension. Display the total for the column. | The options are Mean, Minimum, Maximum, and Sum. The default is Sum. |
DECIMAL PLACES | It allows you to specify the decimal places for the numeric columns in the Total Column. | The default option is Auto. The value starts with 0. |
DISPLAY UNIT | You are allowed to select the display unit for the numeric columns. | The default option is None. You can select between Thousand and Lakhs. This is generally used for currency. |
Reset to default | When you click this link, all the settings have defaulted. |
First, plot a Table chart using the measures from the dataset to use Total formatting options. The formatting options are applied to labels and values both. For example, we plot a table EmployeeCunt by Department and Gender. The table with default settings is displayed below.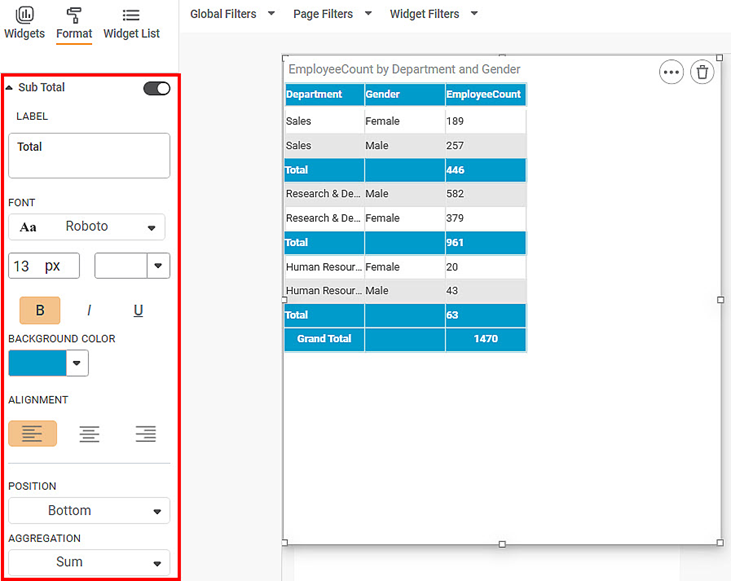
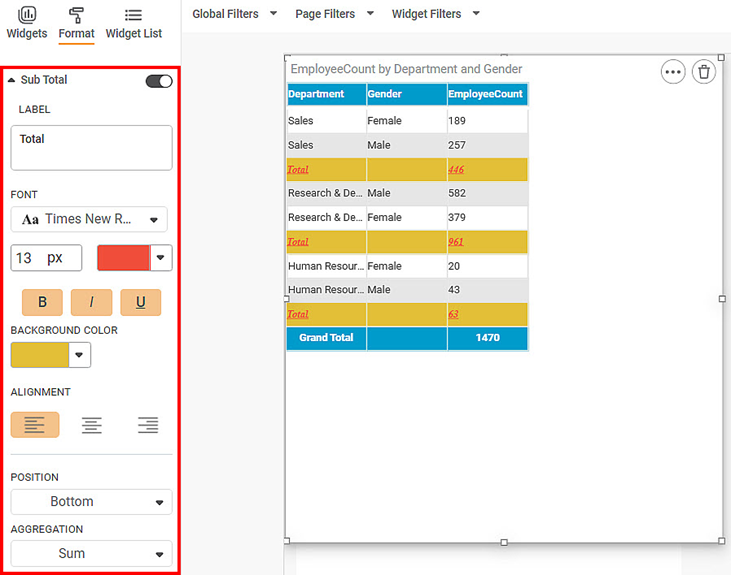
The Figure below displays the overall look and feel after modifying the following options:
- Decimal Places
- Position
- Background color
- Font parameters
Column Grand Total in CrossTable Widget
The Column Grand Total formatting option is available in the Cross-Table widget. The column Grand Total displays the total for each Row. The Column Grand Total has the following formatting options.
The table given below describes different fields present in Column Total formatting.
Field | Description | Remark |
|---|---|---|
LABEL | The default | The default value is Grant Total |
LABEL FONT | It allows you to change the appearance of the Label. | The default font is Roboto, 11px, Bold, #ffffff |
BACKGROUND COLOR | It allows you to change the background color of the label Column. | By default, the color is #DD497E |
ALIGNMENT | It allows you to change the text alignment of the label Column. | The default is central alignment |
FONT | It allows you to change the appearance of the Grand Total column. | The default font is Roboto, 11px, Bold, #252423 |
BACKGROUND COLOR | It allows you to change the background color of the values in the Grand Total column. | — |
ALIGNMENT | It allows you to change the text alignment of the Grand Total Column. | The default is central alignment. |
Word Wrap | It allows you to Wrap the word so that the column width will not change. | The default setting is On. You can toggle in the On/Off settings. |
POSITION | It allows you to switch the Column position. | The default is Right. |
AGGREGATION | It performs the Aggregation function on the column for distinct Dimension. Display the total for the column. | The default is Sum. |
DECIMAL PLACES | It allows you to specify the decimal places for the numeric columns in the Total Column. | The default option is Auto. The value starts with 0. |
DISPLAY UNIT | You are allowed to select the display unit for the numeric columns. | The default option is None. You can select between Thousand and Lakhs. This is generally used for currency. |
Reset to default | When you click this link, all the settings have defaulted. |
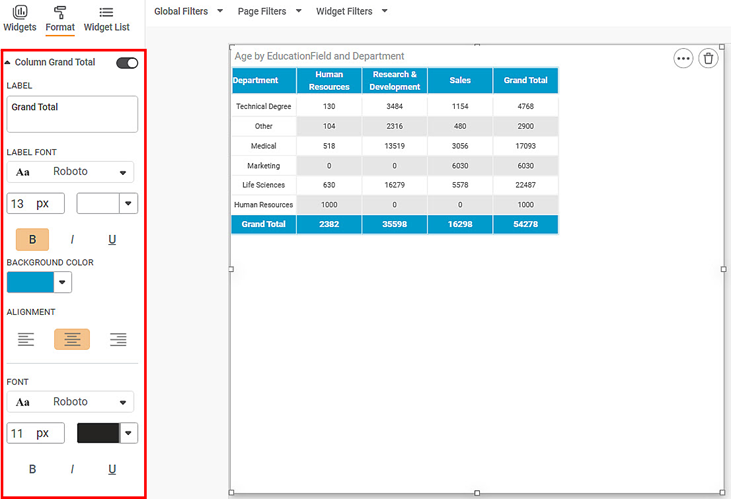
First, plot a Crosstable chart using the measures from the dataset to use Total formatting options. For example, we plot a table Age by Department and EducationField. To use the Column Grand Total formatting options, begin with plotting a Cross Table as shown in the figure below.
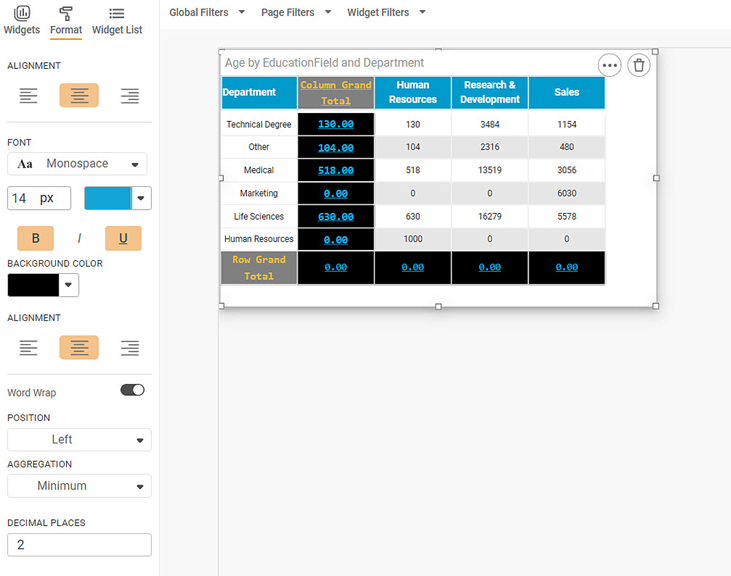
Now,
- Change the Grand Total Label Text.
- Change the Label Font
- Change the alignment, background-color
- Change the font, alignment, and background color of the Grand Total row
- Change Position from Right to Left
- Change Aggregation to Minimum
- Change Decimal to 2
The resultant widget is shown below.
Row Grand Total in CrossTable Widget
The Row Grand Total formatting option is available in the Cross-Table widget. The Row Grand Total displays the total for each column. The Row Grand Total has the following formatting options.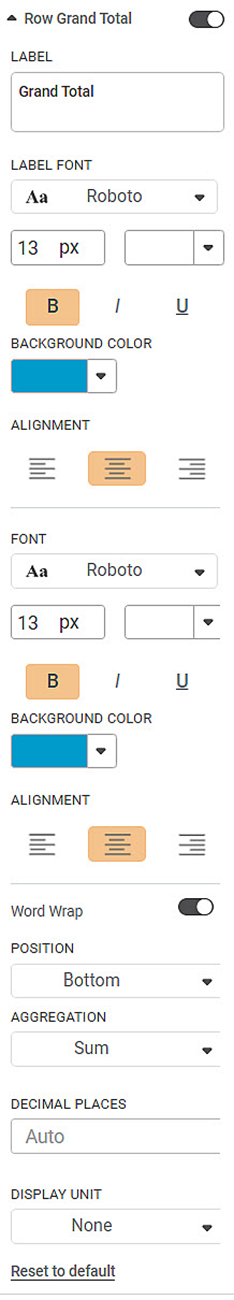
The table given below describes different fields present in Row Total formatting.
Field | Description | Remark |
|---|---|---|
LABEL | It allows you to specify the label of the Grand Total row. | The default value is Grant Total |
LABEL FONT | It allows you to change the appearance of the Label. | The default is Roboto, 13 px, Bold |
BACKGROUND COLOR | It allows you to change the background color of the label row. | By default, the color is #DD497E |
ALIGNMENT | It allows you to change the text alignment of the label row. | The default is Center Alignment |
FONT | It allows you to change the appearance of the values in the Grand Total row. | The default is Roboto, 13 px, Bold |
BACKGROUND COLOR | It allows you to change the background color of the Grand Total row. | The default color is #dd497e |
ALIGNMENT | It allows you to change the text alignment of the Grand Total row. | The default is center alignment. |
Word Wrap | It allows you to Wrap the word so that the column width will not change. | The default setting is On. You can toggle in the On/Off settings. |
POSITION | It allows you to switch the row position. | You can switch the position to either the Top or Bottom. The default is Bottom. |
AGGREGATION | It performs the Aggregation function on the column for distinct Dimension. Display the total for the row. | The options are Mean, Minimum, Maximum, and Sum. The default is Sum. |
DECIMAL PLACES | It allows you to specify the decimal places for the numeric columns in the Total Row. | The default option is Auto. The value starts with 0. |
DISPLAY UNIT | You are allowed to select the display unit for the numeric Row. | The default option is None. You can select between Thousand and Lakhs. This is generally used for currency. |
Reset to default | When you click this link, all the settings have defaulted. |
First, plot a Table chart using the measures from the dataset to use Total formatting options. For example, we plot a table Age by Department and EducationField. To use the Row Grand Total formatting options, begin with plotting a Cross Table as shown in the figure below.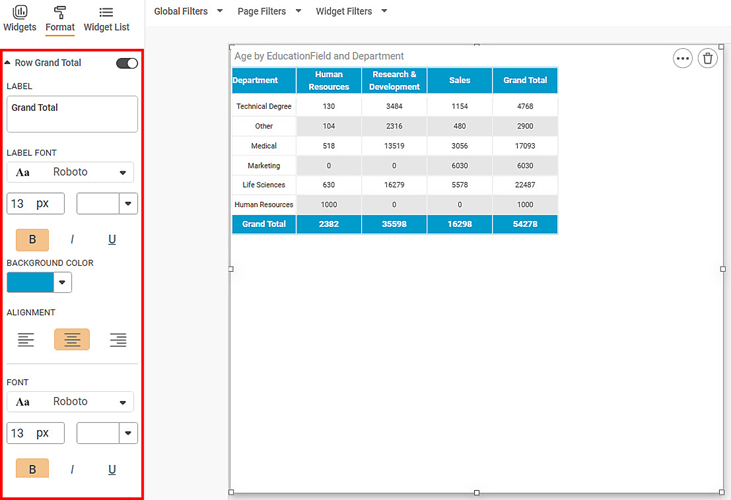
Now,
- Change the Grand Total Label Text.
- Change the Label Font
- Change the alignment, background-color
- Change the font, alignment, and background color of the Grand Total row
- Change Position from Right to Left
- Change Aggregation to Minimum
- Change Decimal to 2
The resultant widget is shown below.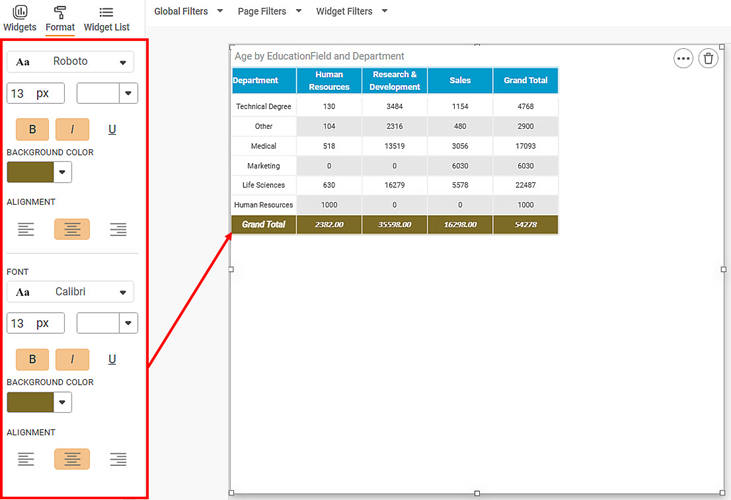
Row Subtotal in CrossTable Widget
The Row Subtotal option is also available in the CrossTable widget. The Row Subtotal displays subtotal for the column and the row. The Row Subtotal has the following formatting options.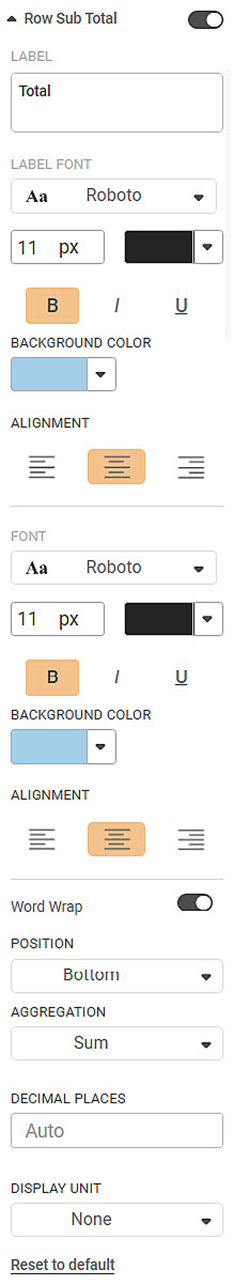
The table given below describes different fields present in Row Total formatting.
Field | Description | Remark |
|---|---|---|
LABEL | It allows you to specify the label of the Grand Total row. | The default value is Total |
LABEL FONT | It allows you to change the appearance of the Label. | The default is Roboto, 11 px, Bold |
BACKGROUND COLOR | It allows you to change the background color of the label row. | By default, the color is #ffd6e5 |
ALIGNMENT | It allows you to change the text alignment of the label row. | The default is center alignment. |
FONT | It allows you to change the appearance of the Grand Total row. | The default is Roboto, 11 px, Bold |
BACKGROUND COLOR | It allows you to change the background color of the Grand Total row. | The default color is #ffd6e5 |
ALIGNMENT | It allows you to change the text alignment of the Grand Total row. | The default is center alignment. |
Word Wrap | It allows you to Wrap the word so that the column width will not change. | The default setting is On. You can toggle in the On/Off settings. |
POSITION | It allows you to switch the row position. | The default is Bottom. |
AGGREGATION | It performs the Aggregation function on the column for distinct Dimension. Display the total for the row. | The default is Sum. |
DECIMAL PLACES | It allows you to specify the decimal places for the numeric columns in the Total Row. | The default option is Auto. The value starts with 0. |
DISPLAY UNIT | You are allowed to select the display unit for the numeric Row. | The default option is None. You can select between Thousand and Lakhs. This is generally used for currency. |
Reset to default | When you click this link, all the settings have defaulted. |
First, plot a Table chart using the measures from the dataset to use Total formatting options. For example, we plot a table EmployeeCount by, EducationFiled, Gender, and Department. To use the Row Subtotal formatting options, begin with plotting a Cross Table as shown in the figure below.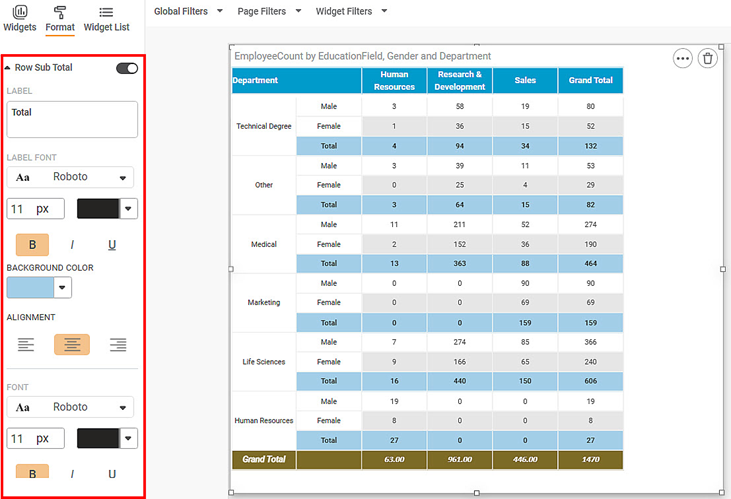
Now,
- Change the Subtotal Label Text.
- Change the Label Font
- Change the alignment, background-color
- Change the font, alignment, and background color of the Grand Total row
- Change Position from Bottom to Top
- Change Decimal to 2
The resultant widget is shown below.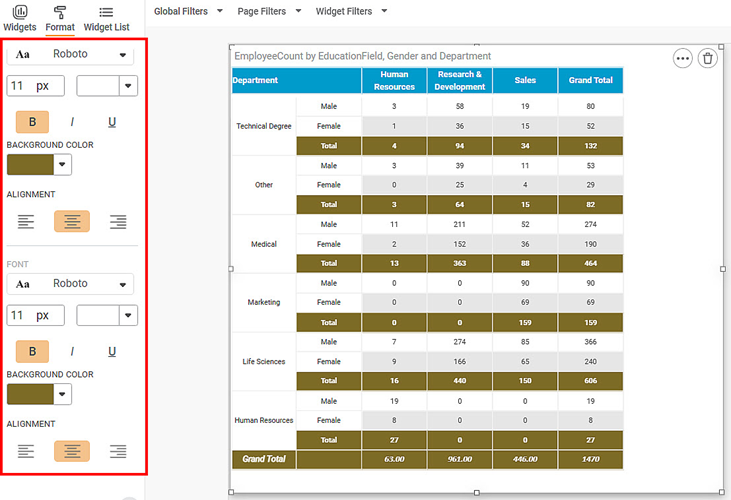
Column Subtotal in CrossTable Widget
The Column Subtotal option is also available in the CrossTable widget. The Column Subtotal displays subtotal for the row and the column. The Column Subtotal has the following formatting options.
The table given below describes different fields present in Column Total formatting.
Field | Description | Remark |
|---|---|---|
LABEL | It allows you to specify the label of the Grand Total row. | The default value is Total |
LABEL FONT | It allows you to change the appearance of the Label. | The default is Roboto, 11 px, Bold |
BACKGROUND COLOR | It allows you to change the background color of the label row. | By default, the color is #ffd6e5 |
ALIGNMENT | It allows you to change the text alignment of the label row. | The default is center alignment. |
FONT | It allows you to change the appearance of the Grand Total row. | The default is Roboto, 11 px, Bold |
BACKGROUND COLOR | It allows you to change the background color of the Grand Total row. | The default color is #ffd6e5 |
ALIGNMENT | It allows you to change the text alignment of the Grand Total row. | The default is center alignment. |
Word Wrap | It allows you to Wrap the word so that the column width will not change. | The default setting is On. You can toggle in the On/Off settings. |
POSITION | It allows you to switch the row position. | You can switch the position to either the Right or Left. The default is Right. |
AGGREGATION | It performs the Aggregation function on the row for distinct Dimension. Display the total for the column. | The options are Mean, Minimum, Maximum, and Sum. The default is Sum. |
DECIMAL PLACES | It allows you to specify the decimal places for the numeric columns in the Total Row. | The default option is Auto. The value starts with 0. |
DISPLAY UNIT | You are allowed to select the display unit for the numeric Row. | The default option is None. You can select between Thousand and Lakhs. This is generally used for currency. |
Reset to default | When you click this link, all the settings have defaulted. |
First, plot a Table chart using the measures from the dataset to use Total formatting options. For example, we plot a table EmplyeeCount by EducationField, Department, and Gender. To use the Column Subtotal formatting options, begin with plotting a Cross Table as shown in the figure below.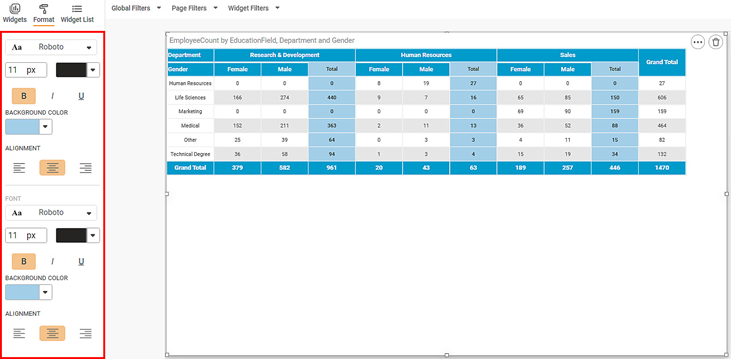
Now,
- Change the Subtotal Label Text.
- Change the Label Font
- Change the alignment, background-color
- Change the font, alignment, and background color of the Grand Total row
- Change Position from Right to Left
- Change Decimal to 2
The resultant widget is shown below.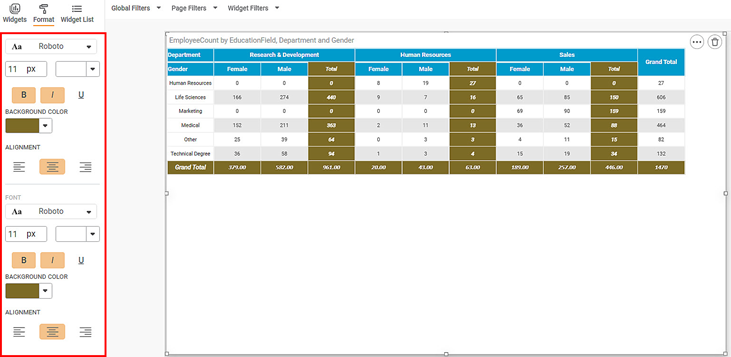
Related Articles
Grand Total
The Grand Total formatting option is available in the Cross Table widget. By default, the Grand Total formatting options are not visible. Turn the toggle button ON () to use the Grand Total formatting options. The table given below describes ...Total
The Total formatting option is available in the Table chart. The table given below describes different fields present on Total formatting. Field Description Remark Label It allows you to select the label you want to assign for the Total column. — ...Support Advance Sort with Grand Total Column in Cross Table
Refer Advance Sort for configuring sorting on the widgets. Cross Table has additional configuration in Advance Sort, to add sorting condition based on the Column Grand Total. To understand the configurations, follow the below steps: 1. Plot cross ...Decimal Place Formatter
Formatting a Table You can format the tables that appear in various charts. Tables can be plotted standalone like Table and Cross Table, or they accompany other charts (like Sparkline Chart in which they accompany a Line, Area, or Column Chart). The ...Formatting a Table
This formatting applies to widgets that contain tables. For example, table formatting is possible for widgets such as Table and Cross Table. To format the chart, follow the steps given below. Create the number of charts as required. Refer to Creating ...