Hierarchy of Things
Understanding Hierarchy
A hierarchy in RubiThings is the visualization mode of locations and their constituent things.
Understanding the Hierarchy Home Page
The RubiThings Hierarchy page is shown below.
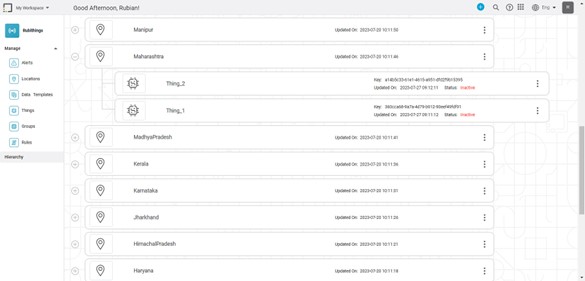
The Hierarchy Page displays a list of all locations registered on the system. You can view
- The latitude and longitude of the location
Last modified date and time of the location
Click on | To |
Location | View its details of the location |
Expand icon ( | View the things ( |
Thing | View the details of the Thing |
Collapse icon ( | Hide the things ( |
 ) next to a location (
 )
) ) created under that location
You can also perform multiple operations on the locations and things from the Hierarchy page.
Hover over | To |
Location |
|
| Thing |
|
Related Articles
Managing Things
Understanding Things A thing in RubiThings is any physical object, such as an intelligent sensor or edge device that can transfer data over a network, any of the IoT-enabled devices Adding a New thing You can add a thing by Clicking Things in the ...Understanding the RubiThings Homepage
The RubiThings home page is the default page assigned to you to visualize the overall activity occurring in your workspace. When you log in for the first time, the home page canvas is blank. That's because you have not configured any "Thing." You see ...Hierarchies in Data Dictionary
Creating Hierarchy In a data dictionary, you can rearrange or change the order of the features of the newly created dataset using the Hierarchy function. Note: The created hierarchy can be used only in the Dashboard application. To create the ...Using Dashboard Hierarchies
In a data dictionary, you can rearrange or change the order of the features in the newly created dataset using the Hierarchy function. The created hierarchy is used in the RubiSight application. To use the created hierarchy in a dashboard, follow the ...Live Data
Data visualization is the representation of data in the form of pictures, images, graphs, or any other form of visual illustration. In RubiThings, Live Data is visualized in the form of Line Chart, SolidGauge, and Speedometer. To fetch the live data, ...