Understanding the Forecasting Workbook Canvas
The workbook canvas is the area where you can build algorithm flows. When you open a workbook, the following icons and fields are displayed.
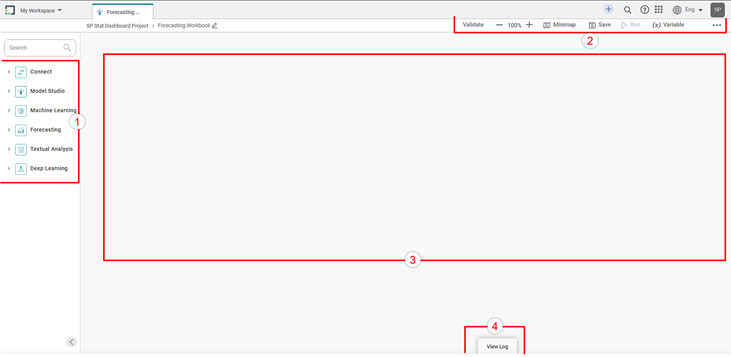
The workbook screen has four panes, as given below.
- Task Pane: This pane displays the datasets and algorithms used in the workbook.
- Function Pane: This pane displays the various functions performed on the workbook.
- Workbook Canvas: The work area where you can drag-and-drop algorithms and datasets to create workbooks.
- VIEW LOG: This tab displays the logs and activity trace of the workbook execution.
The table below describes the fields and icons present on the Workbook Canvas.
Icons/Fields | Description | |
|---|---|---|
Task pane | It displays the list of datasets and algorithms used in the workbook. | |
| Name of the workbook | It displays the title of the workbook. |
| Validate | It validates the workbook created on the canvas. |
| Zoom | It helps to move your point of view closer to or further away from the canvas. It works as a screen magnifier that changes the canvas's detailing level to be seen. |
| Minimap | It displays a scaled-down version of the workbook. |
| Save | It saves your workbook. |
| Run | It runs the created algorithm flow. |
| Variable | It is used to add your variable to be used anywhere in the workbook. |
| Save As | It saves your workbook with a different name. |
| Snapshot | It takes a snapshot of the created algorithm flow. The snapshot can be restored later for version control. |
Workbook Canvas | It is the area to experiment with your datasets and algorithms. You can use the drag-and-drop method to insert datasets and algorithms in the workbook canvas. | |
VIEW LOG | It displays the logs of the algorithm flow that are run. | |


Related Articles
Components in Forecasting
Forecasting deals with the analysis and detection of trends in the time-series data. The components of forecasting are, Data Exploration: Data Exploration is used to explore the time-series data. It helps in identifying the underlying parameters ...Understanding the Workbook Canvas
The workbook canvas is the area where you can build algorithm flows. When you open a new workbook, the following icons and fields are displayed. The workbook screen has four panes, as given below. Task Pane: This pane displays the datasets and ...Building Algorithm Flow in a Forecasting Workbook Canvas
Building algorithm flow in a Forecasting Workbook is similar to that in Model Studio. To build algorithm flow in a Workbook Canvas in Model Studio, refer to Building Algorithm Flow in a Workbook Canvas.Creating a Workbook in Forecasting
To create a workbook, follow the steps given below. On the home page, click the Create icon (). Hover over the Forecasting tile and click the Create Workbook button. Create Workbook screen is displayed. Enter the Name for your workbook. Enter the ...Understanding WorkFlow Canvas
The workflow canvas is the area where you can build algorithm flows. When you open a workflow, the following icons and fields are displayed. The workflow screen has four panes as given below. Task Pane: This pane displays the datasets and algorithms ...