Unlock Value Axis in Dual Axis Chart
A secondary value axis (or Line Y-axis) appears when you plot a dual-axis widget (like the Combination Chart containing Columns and Line); a secondary value axis (or Line Y-axis) appears. Many times, the values of data points plotted on the Line Y-axis are very small. They appear when you hover over the column. For this purpose, the Line Y-axis is plotted to make the reading and understanding of the Line values easier.
For plotting the Combination Chart, you select:
- One variable to configure X-axis, and
- One variable each to configure the two Y axes, Column Y-axis, and Line Y-axis.
General settings associated with the Line Y-axis are the same as those for the column Y-axis.
The table given below describes different fields present on General formatting in Y-axis.
Field | Description | Remark |
Width | It allows you to select the width of the line used to represent the Y-axis. | By default, the width selected is zero. |
Color | It allows you to select the color of the line used to represent the Y-axis. | — |
Scale | It allows you to select the scale in which the variable represented on the Y-axis is plotted | You can select one of the following scale options
|
Start | It allows you to select the initial coordinate value at the origin from where the Y-axis starts. |
|
End | It allows you to select the final coordinate value up to which the variables on Y-axis are plotted. |
|
To use General formatting options for the Line Y-axis, first plot a Column Chart using the dimensions and measures from the dataset. For example, we plot a Combination Chart of the Count of Limit and Count of Rating against Cards. The Gender and Ethnicity of the sample are the Column and Line Legend, respectively.
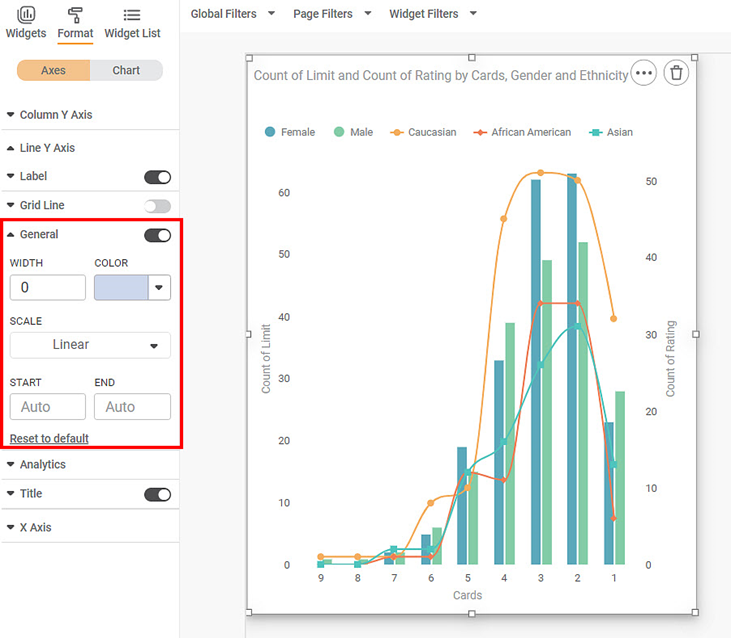
The figure given below shows an original image of the Combination Chart. By default,
- The width of the Line Y-axis is zero; that is, the axis is not visible on the plotted chart.
- The scale selected is Linear.
- The starting and ending coordinates on the Line Y-axis are auto selected. In the figure, the starting and ending coordinates of the Line Y-axis are zero (0) and 50, respectively.
Now, change the
- Width of the Line Y-axis line
- Color of the Line Y-axis line
- Starting and Ending coordinates of the Line Y-axis line. Here we choose -5 and 100, respectively.
The resultant widget is shown below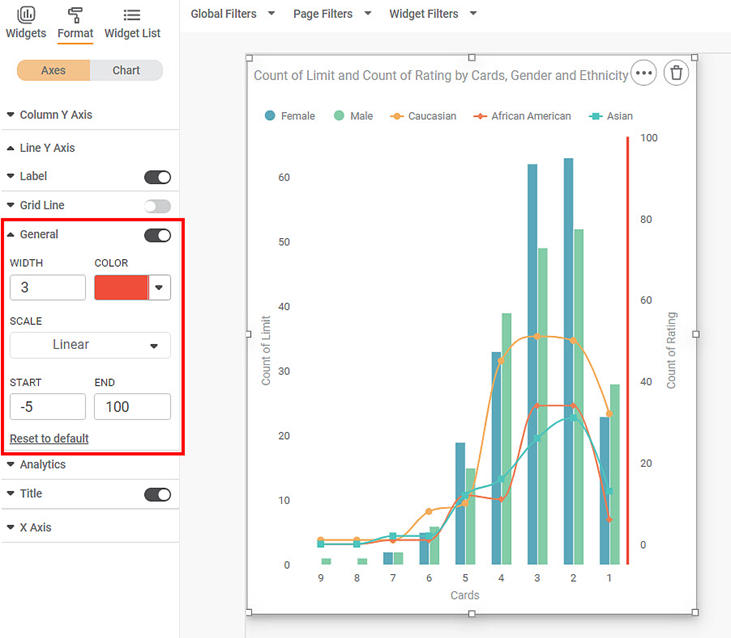
Now, change the
- Y-axis scale to Logarithmic.
- Starting and Ending coordinates of the Y-axis line. Here we choose 1 and 150, respectively. [Since log (0) = 1, the logarithmic scale starts from one (1), if the linear scale starts from zero (0).]
The resultant widget is shown below.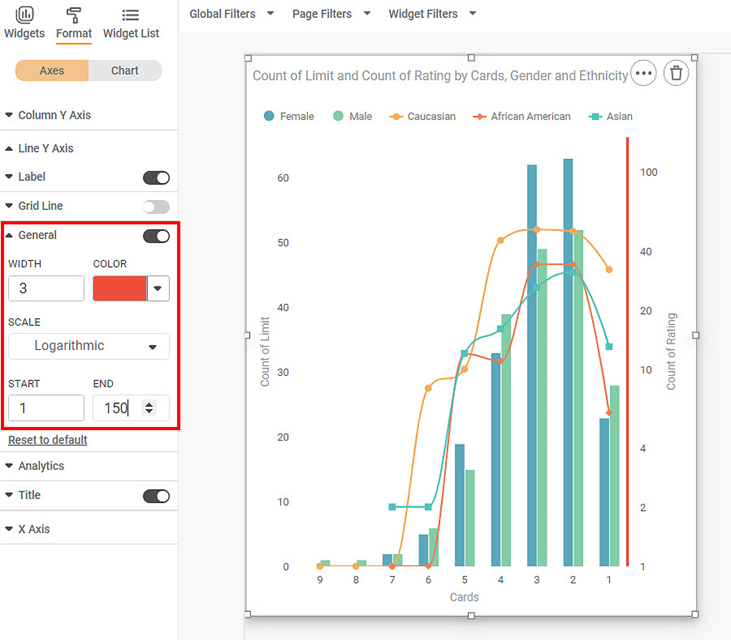
Note: | When you change the Start and End values for the Combination Chart or change the scale, it resizes and adjusts according to the newly selected range. |
Related Articles
Axis
Here, the word 'Axis' refers to the X-axis. The figure below shows the various fields present in the Axis formatting in the X-axis. The table given below describes different fields available for Axis formatting for X-axis. Field Description Remark ...Axis Label (Y-axis)
Axis Label is the parameter that represents the variable plotted on the Y-axis. The table given below describes different fields present on Axis Label formatting in Y-axis. Field Description Remark Text It allows you to modify the parameters of the ...Color Axis
The Color Axis formatting option is available for Map chart. The table given below describes different fields present for Color Axis formatting. Field Description Remark Min Color It allows you to change the color of the Minimum value on the Map ...Gauge Axis
The Gauge Axis formatting option is available in the Solid Gauge Chart. This allows you to select the Minimum, Maximum, and Target values for the chart. Note: These options are visible only if Min/Max/Target are not selected in the Widget ...Axis Title ( Y-axis)
Axis title is the heading that you want to give to the Y-axis. The table given below describes different fields present on Axis Title formatting in Y-axis. Field Description Remark Text It allows you to give a suitable title to the axis. Axis title ...