Widget List
The Widget List option is present in the Widget pane, next to Widgets and Format tabs.
The Widget List is used to display the list of plotted widgets on a Dashboard page in a particular sequence. The last plotted widget appears first in the list, while plotted first appears last of the list.
The image below shows that the Column Chart is plotted first and is at position 3 in the Widget List, while the Treemap Chart is plotted last and hence is at position 1.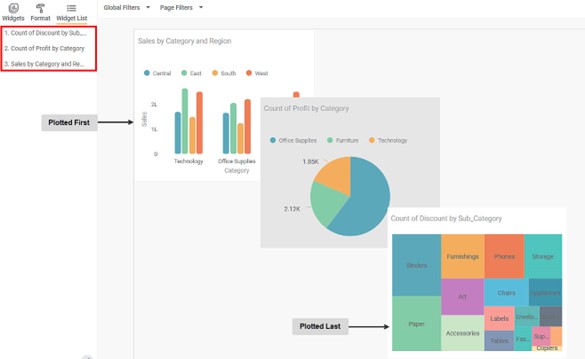
Notes: |
|
The Widget List can be used to perform the following actions.
Highlight a Widget
When you click a widget title in the list, a border appears on the corresponding widget on the Dashboard.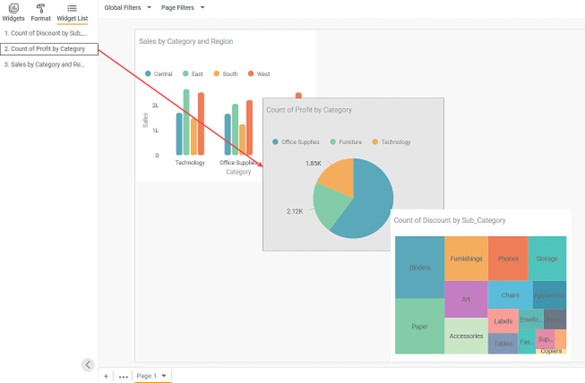
Notes: |
|
Change Widget Order
You can drag widget titles and change the order in which they appear in the list. The corresponding effect is observed on the Dashboard. It works as an alternative for the Send to Back and Bring to Front functionality present on widgets.
For example, drag the Sales by Region and Category to the top of the list. On the Dashboard page, it appears on top of the remaining two widgets.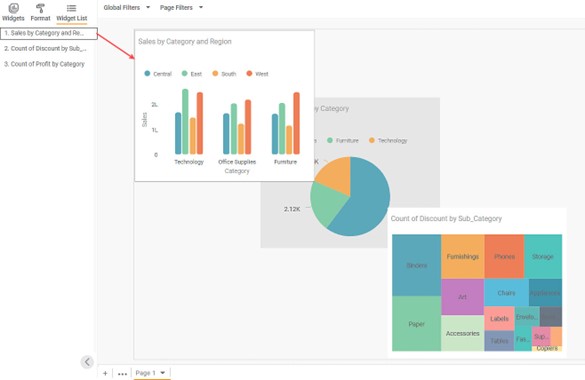
Notes: |
|
Show/Hide Widgets:
You can hide a widget if it is not required to be displayed on the Dashboard for any reason. For this, hover over the widget title and click the Hide Widget Icon (  ).
).
The widget gets hidden (disappears) from the Dashboard page. Also, the widget title in the list gets blurred, and a Show Widget Icon (  ) appears next to it.
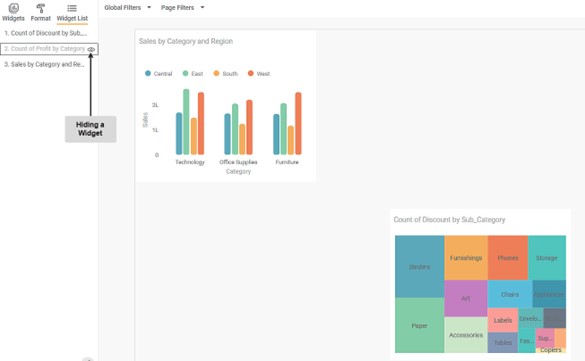
If you want to view the widget again, click the Show Widget Icon Icon ( ). The widget appears in the same position.
Related Articles
Widget Filter
Widget filters are activated when we click on a particular widget; that is, they are applied only to the selected widget. To apply widget filters, follow the steps given below. Create the number of charts as required. Refer to Creating Charts using ...User Defined Widget Name
The Widget Name Formatter allows users to assign meaningful, custom names to widgets across all chart and widget types in RubiSight dashboards. This helps in easy identification of widgets during interactions such as filtering, interactivity control, ...Generate Widget Level Insights
Widget-Level Insights (Narration) The RubiAI Widget-Level Narration feature enables AI-generated summaries specific to each individual widget. This allows users to derive insights based on the data visualized in a single chart or graph, considering ...Search Option In Filter Widget
In RubiSight, a Filter Widget filters data present in other widgets on the same dashboard page. Usually, a categorical feature is used to plot a filter widget. When you plot a filter widget, the values appear on the filter widget in the form of List ...Creating Custom Visualization Using Python Widget
The Python widget in RubiSight allows you to create custom data visualizations that are not already available in RubiSight. To create a custom visualization, you need to write Python code in the code editor. The Python widget supports libraries such ...