Working with AutoML in Rubiscape
Auto ML is a process that helps you to build models with the help of predefined datasets. You can select your datasets, the dependent, and the independent variables, and run the model. AutoML wizard suggests the best fit model for your dataset.
Running AutoML
To run the Auto ML , follow the steps given below.
- On the Rubiscape home page, open any Dashboard / Workbook / Workflow.
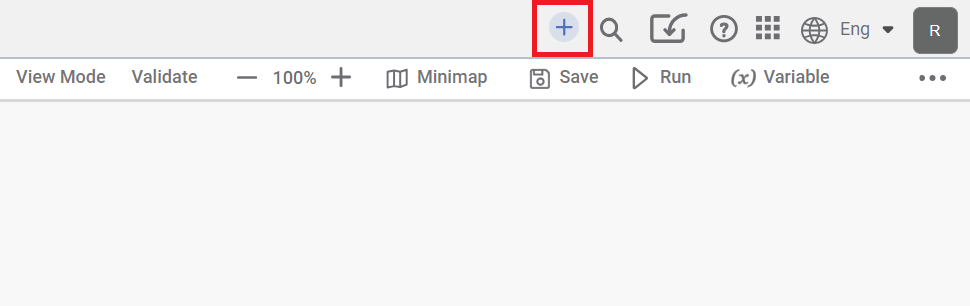
Create ( ) icon is displayed in the top right corner.
 - Select create () and select AutoML option.
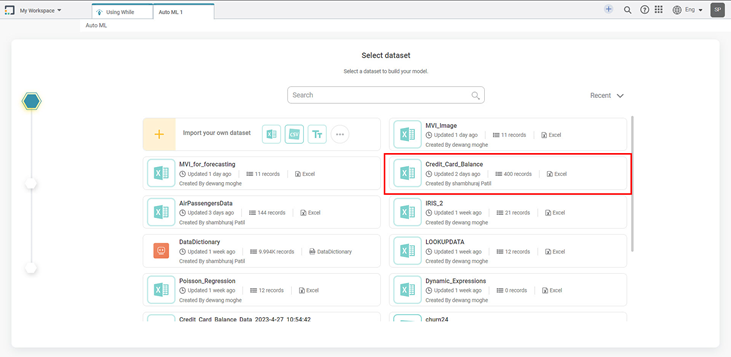
Select Dataset page is displayed. - Select the Dataset that is available in the application or you can import your Dataset. Refer to Managing Datasets.
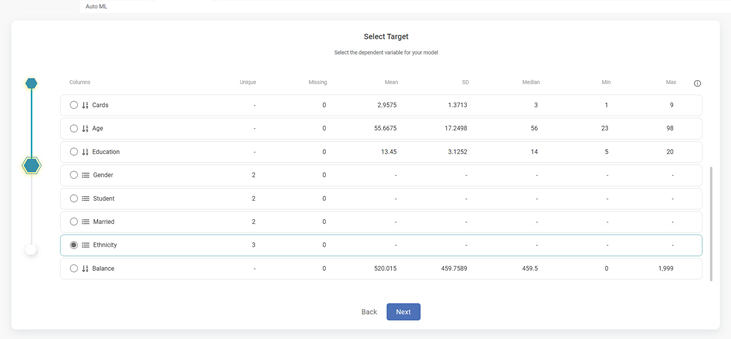
Select Target page is displayed.
Select the radio button corresponding to the Target or Dependent variable you want to select.
Note:
If the target variable is Categorical, you will get Classification algorithms and if the target variable is Numerical, you will get Regression algorithms.
- Click Next.
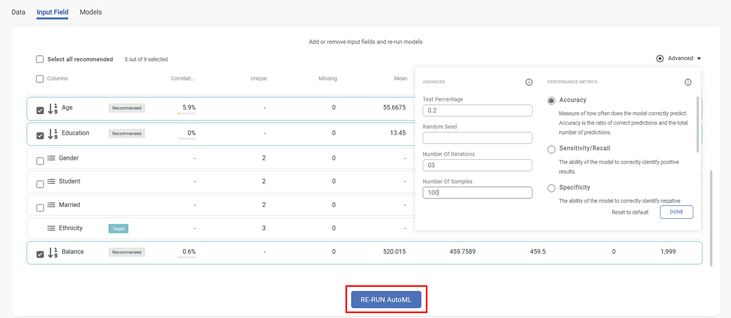
Select Input Fields page is displayed. - Select the check boxes corresponding to the independent variables you want to select. If you want to select all the independent variables, select Select recommended.
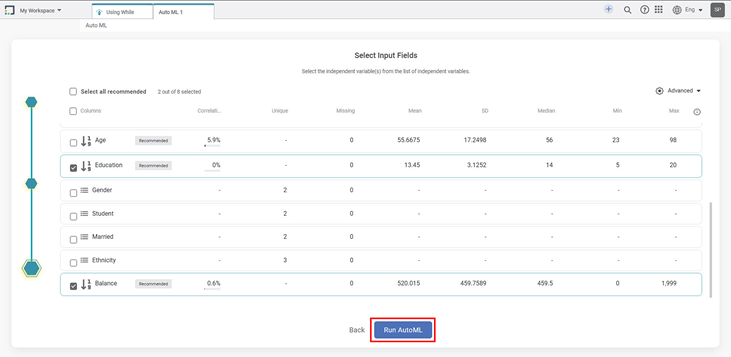
- Click Advanced gear icon in the top right corner.
- Select the Advanced Properties and Performance Metrics.
- After selecting the required parameters, click DONE.
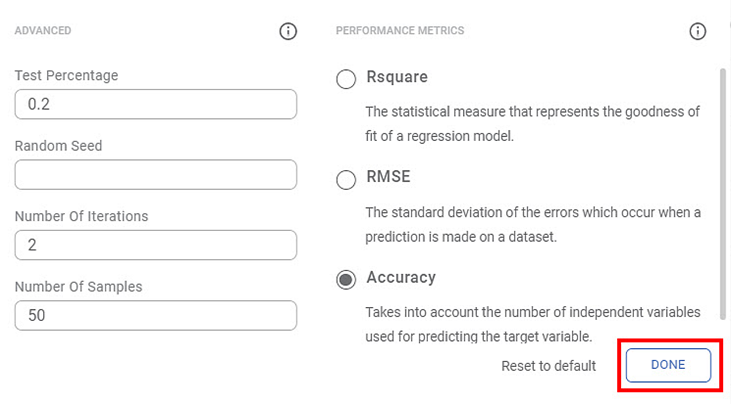
The table below describes the Advanced properties.
Property
Description
Test Percentage
This is the percentage of the total dataset that is used to test the model.
Random Seed
It is used to ensure that results are reproducible.
Number Of Iterations
It is the repetition of the process to generate the outcome.
Number of Samples
It shows the number of observations taken from the population.
The performance metrics are rendered depending on the selection of selected target variable.
The table below describes the various Performance Metrices based on the target variable.Target Variable
Recommended Algorithm
Performance Metrices
Categorical Classification - Sensitivity -
- Specificity -
- F-Score -
Numerical Regression - RMSE - The standard deviation of the errors which occur when a prediction is made on a dataset.
- MAPE -
- R Square -
- W Stats -
- P Value -
Note: - To get accurate results, keep the Number of Iterations and Number of Samples high. However, also note that, the Wizard takes more amount of time if Iterations and Samples are more. So, you need to select the optimum values.
- The selected Performance Metrics attribute is used only for sorting the result.
Click Run ML.
The results are displayed after the execution of the model completes.
Viewing the Result
After running Auto ML, you get the result in the form of a chart and other statistics. It recommends the model and pipelines for the given data that the wizard comes across during the training of the model. The Result page shows the detailed metrics of the recommended model and pipelines.
Note: | Pipelines are executed by AutoML and it depends upon Number of Iterations and Number of Samples. |
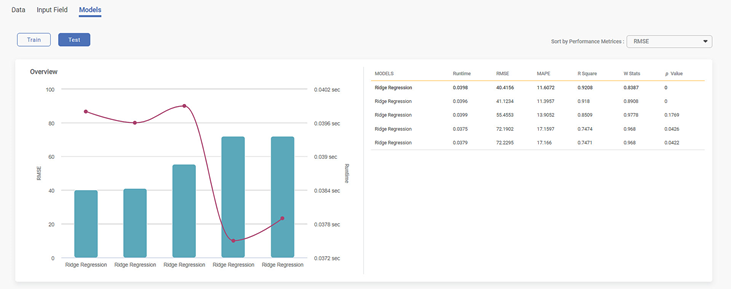
The result page shows two types of results i.e. Result on Train data and Result on Test data.
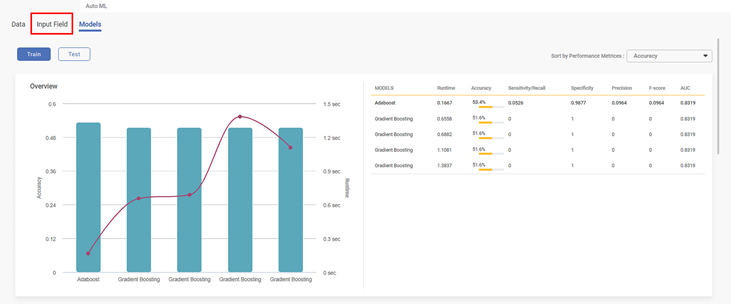
The metrics in the Train data result are different from the Test data result. Train Data result is displayed by default, you can see the Overview result in the form of a Bar chart. On the right side of the Bar chart, models are recommended with all statistics.
While viewing the Data, you can choose to see the result sorted as per performance metrics applicable for the selected algorithm.
Performance metrics are part of the results of the algorithm. Runtime values change for the algorithm when you select train data and test data. The train data results are displayed in the below figure.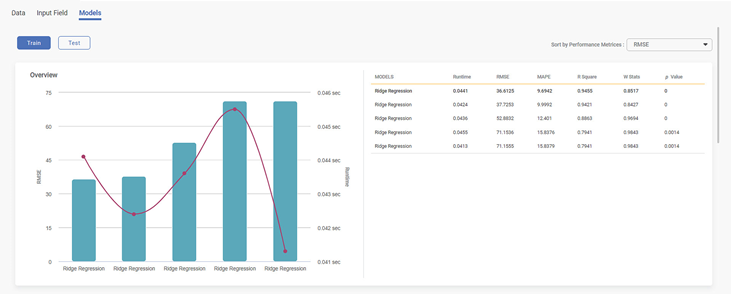
The Test data results show the changes in the runtime of the model and the performance metrics of the recommended model and pipelines. All these metrics are different from the train data results.
iewing details of the Recommended Model or Pipelines
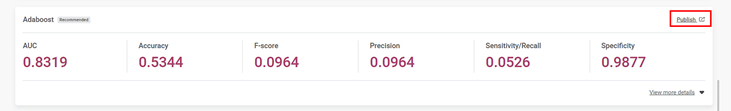
The details of the particular model and pipelines are displayed as per the performance metrics. Here, you can see the details of the parameters of the model and pipelines are built.
To see the details of the models and pipelines parameters, follow the steps given below, click View more details on the Result page, on the right side of the model.
For Classification Algorithms, You see the confusion metrices and specified algorithm parameters for the Classification algorithm only. The same procedure can be followed to see the detailed metrics for recommended pipelines.
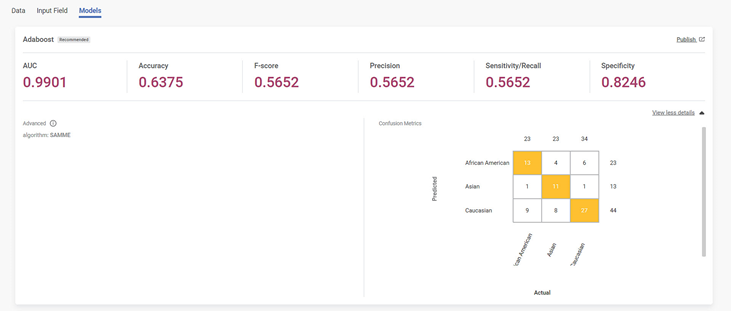
Note: | The Confusion metrics graph is only for Classification algorithms. If you get Regression algorithm as recommended model, Confusion metrics and graph are not shown. |
Re-running the Model
The option of Re-Run ML is available in the wizard to change the parameters that have been selected earlier. If you do not want to use the recommended model, you can tweak some parameters and run the model again. After Re-Run of the model, you will get a new set of recommended models and pipelines.
To Re-Run ML follows the steps given below.
- On the Result page, click Input Field.
- Select the independent Variables or change the Advanced properties.
Click Re-Run ML.
Notes:
- The curved line on the bar chart shows the run time that ML takes to configure the algorithms to give the best fit model for the given data.
- Run time depends upon the number of Iterations and samples, and also on the server.
 New Recommended models and pipelines are displayed.
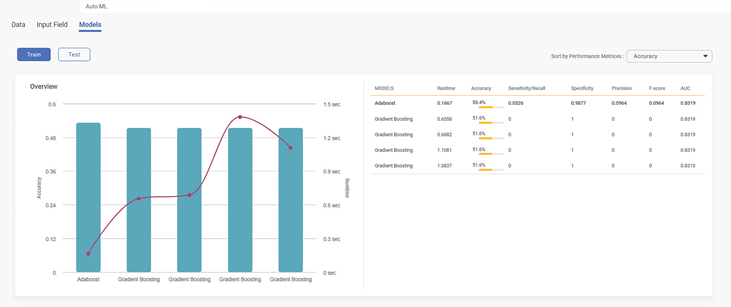
Publishing the Recommended Model or Pipelines
Once you get the recommended model and pipelines, you can publish them.
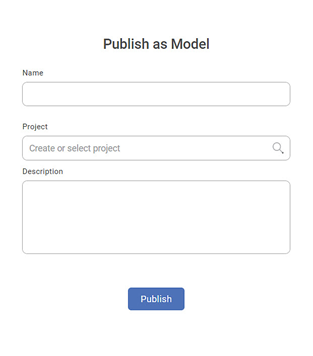
To publish the model, follow the steps below.
- In the top right corner of the recommended model, click Publish.
Publish as Model page is displayed.- Enter the Name of the model.
- Select the Project name.
- Enter Description.
Click Publish.
Note:
You can Publish a pipeline, explore it, and see the result.
Exploring the Recommended Model
When you use the Auto ML wizard, it creates a workbook for you. This workbook is created inside your current workspace and available even after you close the Auto ML wizard. You can perform workbook tasks on it.
Exploring the Recommended Model from Auto ML Wizard
To explore the model, follow the steps given below.
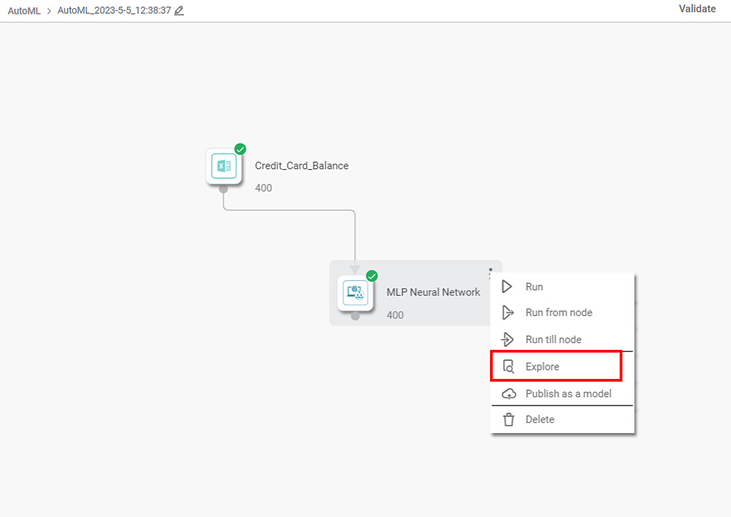
- Open the AutoML workbook from your workspace. The default name of the workbook is AutoML preceded by the timestamp on which the workbook was created. (For example, in this case the name of the workbooks is AutoML_2023-5-5_12-38-37)
- Select the algorithm node.
- Click the ellipsis ().
- From the list of options, click Explore.
You can explore the model and see the result of the particular data. It shows a Confusion Matrix, ROC Chart, and Lift Chart for classification.
The result page is displayed. On this page, the performance metrics of the model are displayed.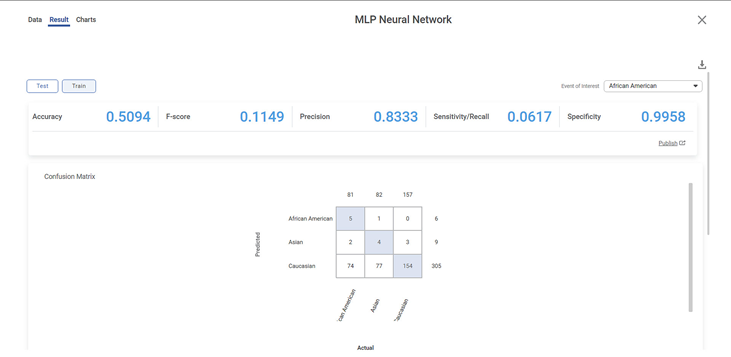
Viewing the Published Model in the Task Panel
To view the publish model in the task panel, follow the steps given below.
- In the task pane, click Model Studio.
- Click Models.
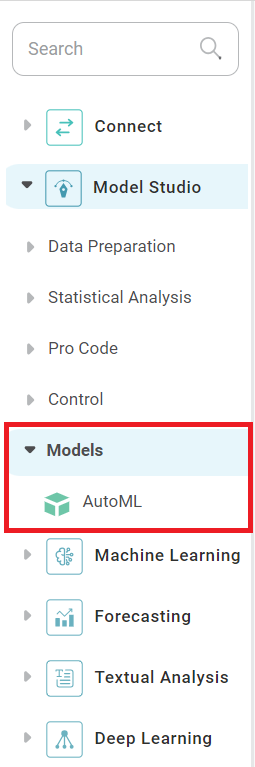
The newly created model is listed.
Managing the Created Workbook
You can manage the Auto ML workbook which is implicitly created by the Wizard.
You can perform all the operations on this workbook. For more details, refer to Working with Workbooks.
You can also validate the model.
Related Articles
AutoML
Introduction to AutoML Wizard AutoML functionality in Rubiscape for Predictive Analytics, you can create, test, deploy, and maintain your predictive models easily and instantly. The Auto ML functionality offers interactive data exploration and makes ...AutoML
AutoML is located under Machine Learning > AutoML in the task pane. Use the drag-and-drop method (or double-click on the node) to use the algorithm in the canvas. Click the algorithm to view and select different properties for analysis. Example of ...Working with File Server
Understanding File Server Pane The File Server allows you upload files/ and folders on Rubiscape cloud storage for the current workspace. You can upload files of all formats and use them while creating a dataset or working with RubiNotebook or ...Rubiscape File Server
The Rubiscape File Server lets you upload files/folders on cloud storage for the current workspace. You can use these files while creating a dataset or working with RubiNotebook or RubiPython. Rubiscape provides you six options to select the source ...Features of AutoML Wizard
The Auto ML Wizard recommends the best fit model for a selected dataset, This recommendation is especially helpful if you do not know which algorithm to use for the selected dataset. Features: Auto-creation of a workbook Import, search or choose a ...