Working with Dashboards
Date Part Options
Rubisight provides various date parts along with the date in the dimensions pane. You can use the following date parts as dimensions
- Year
- Quarter
- Month
- Day
- Weekday
- Week number
Let’s study these options in the below sections.
Consider the Airpassenger dataset with their traveling date as other information.
Date.Year
When you check this dimension, the year part from the date is extracted from the date part. Then data is plotted accordingly.
The following graph displays the number of passengers traveling per year from 1949 to 1960 for specified years.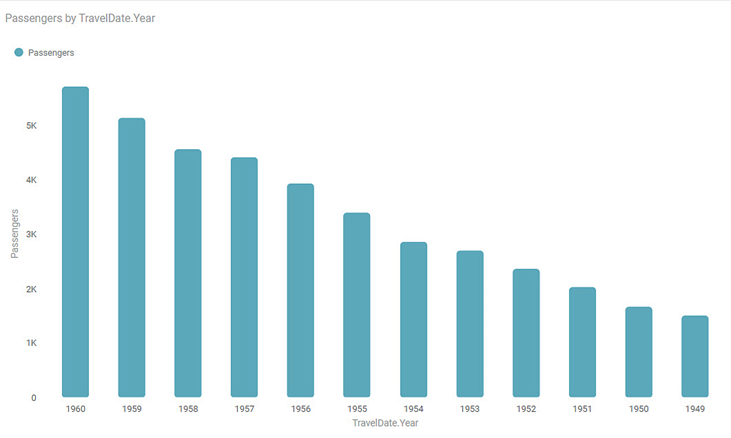
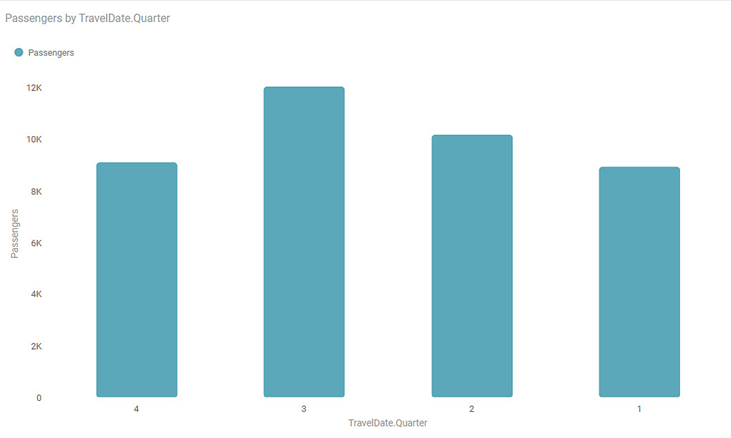
Date.Quarter
When you check this option, the data is segregated into 4 quarters. The Year is not considered in this segregation.
The following graph displays the number of passengers traveling per quarter.
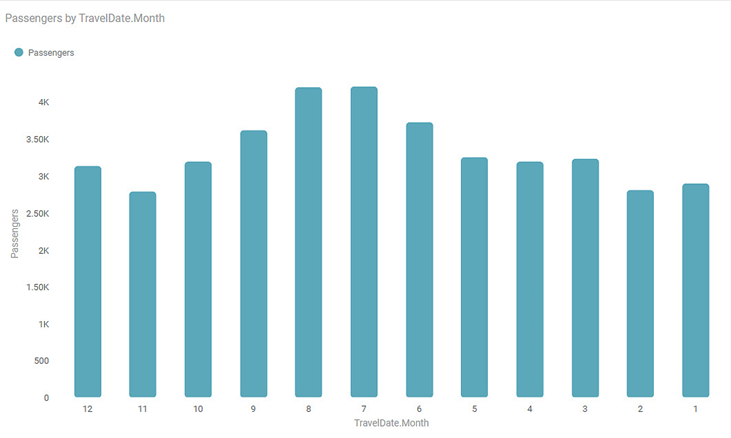
Date.Month
When you check this option, the data is segregated into 12 months. The Year is not considered in this segregation.
The following graph displays the number of passengers traveling per month for specified years.
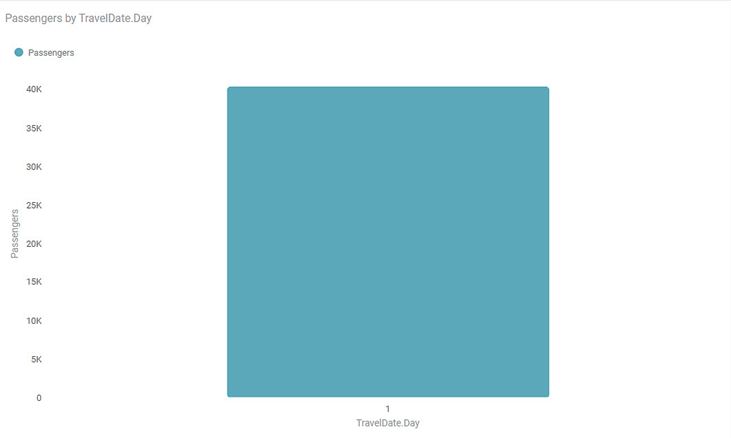
Date.Day
When you check this option, the data is segregated into 31 days. The Year is not considered in this segregation.
The following graph displays the number of passengers traveling per day for specified years.
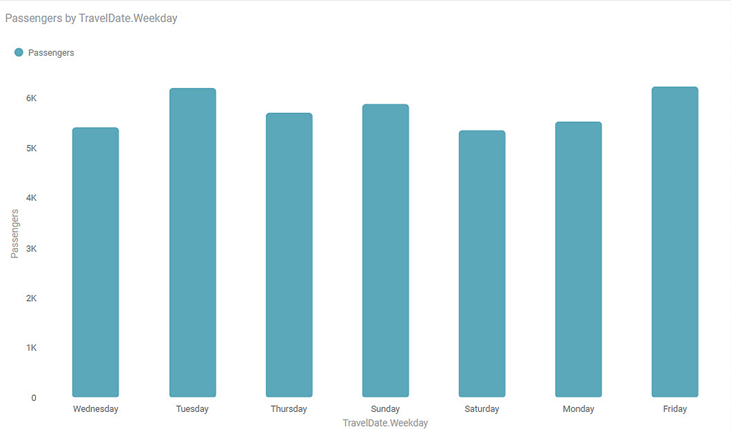
Date.Weekday
When you check this option, the data is segregated into 7 weekdays. The Year is not considered in this segregation.
The following graph displays the number of passengers traveling per weekday for specified years.
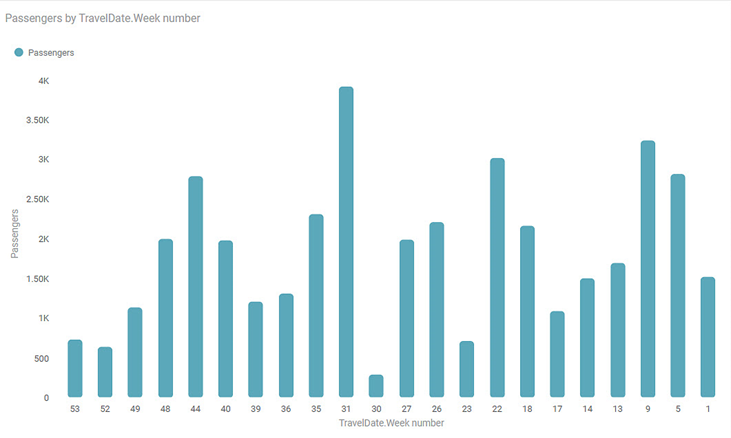
Date.Week number
When you check this option, the data is segregated into 53 weeks. The Year is not considered in this segregation.
The following graph displays the number of passengers traveling per week for specified years.
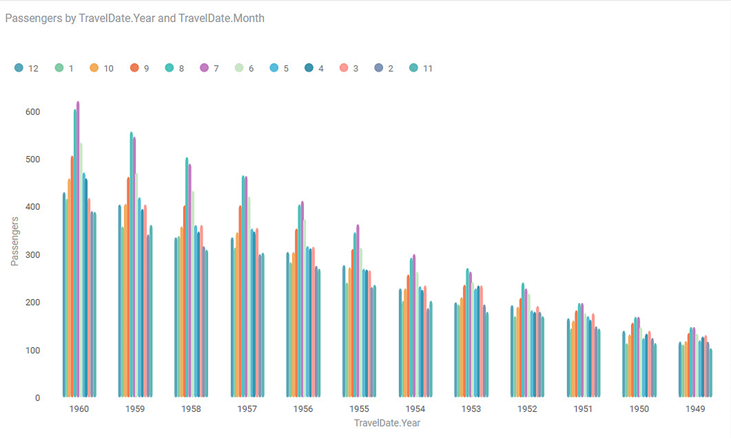
Plotting Date.Year and Date.Month Number
Many times you want to plot a graph using more than one parameter. Consider that you want to plot a bar chart for month-wise and year-wise passengers. Plot the bar chart using the Date. Year and Date.Month to implement this requirement.
Related Articles
Working with Dashboards
What is a Dashboard A dashboard is a graphical user interface (GUI), displaying all the key performance indicators at a glance. In short, it is a progress report generated to gauge the performance of a process, business, and so on. In Rubiscape, a ...Recently Opened Dashboards
The Recently Opened Dashboards section in the RubiSight Mobile App allows users to quickly reopen dashboards they accessed earlier. This improves navigation efficiency and helps users resume their analysis seamlessly. 1. Accessing Recently Opened ...Working with File Server
Understanding File Server Pane The File Server allows you upload files/ and folders on Rubiscape cloud storage for the current workspace. You can upload files of all formats and use them while creating a dataset or working with RubiNotebook or ...Accessing Dashboards in RubiSight Mobile Application
This section describes how to access dashboards, switch between pages, and navigate widgets in the RubiSight Mobile Application. Screenshots below illustrate key elements such as dashboard titles, page numbers, page switchers, and widget layout. On ...Working with AutoML in Rubiscape
Auto ML is a process that helps you to build models with the help of predefined datasets. You can select your datasets, the dependent, and the independent variables, and run the model. AutoML wizard suggests the best fit model for your dataset. ...