Aggregation
Aggregation is located under Model Studio (.png) ) in Data Preparation, in the task pane on the left. Use drag-and-drop method to use the algorithm in the canvas. Click the algorithm to view and select different properties for analysis. Refer to Properties of Aggregation.
) in Data Preparation, in the task pane on the left. Use drag-and-drop method to use the algorithm in the canvas. Click the algorithm to view and select different properties for analysis. Refer to Properties of Aggregation.
Properties of Aggregation
The available properties of Aggregation are as shown in the figure given below.
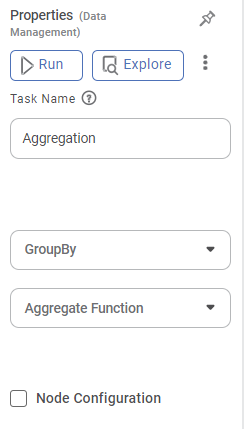
The table given below describes different fields present on the properties of Aggregation.
Field | Description | Remark |
|---|---|---|
| Run | It allows you to run the node. | - |
| Explore | It allows you to explore the successfully executed node. | - |
| Vertical Ellipse | The available options are
| - |
Task Name | It displays the name of the selected task. | You can click the text field to edit or modify the name of the task as required. |
GroupBy | It allows you to select the function for which you want to group the data. |
|
Aggregate Function | It allows you to select the type of data that is to be aggregated. |
|
Example of Aggregation
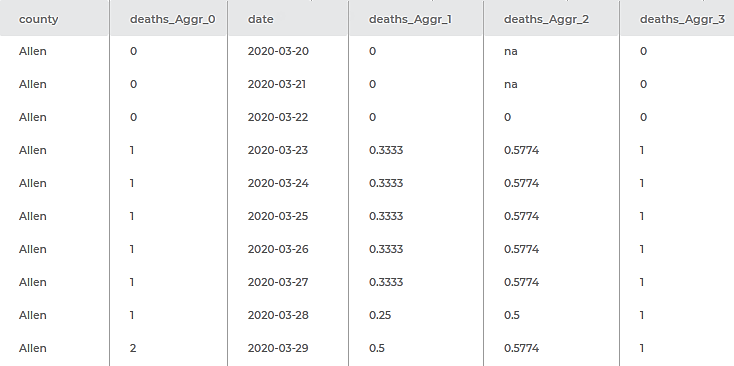
The figure given below displays the output of aggregation performed on sample data. The data of the number of deaths (numerical data) in a US county is aggregated by sum, mean, standard deviation, and the maximum value of the number of deaths. The data is grouped by the name of the county and date (both categorical data).
Field | Result |
|---|---|
county | It displays the name of the US county whose data corresponding to the number of deaths is aggregated. |
deaths_Aggr_0 | It displays the aggregate deaths in that county by the sum of deaths on a particular date. |
date | It displays the date corresponding to which the data is aggregated. |
deaths_Aggr_1 | It displays the aggregate deaths in that county by the mean number of deaths on a particular date. |
deaths_Aggr_2 | It displays the aggregate deaths in that county by the standard deviation of the deaths on a particular date. |
deaths_Aggr_3 | It displays the aggregate deaths in that county by the maximum value of the number of deaths on a particular date. |
Related Articles
Aggregation
Aggregation is located under Model Studio () in Data Preparation, in the task pane on the left. Use drag-and-drop method to use the algorithm in the canvas. Click the algorithm to view and select different properties for analysis. Refer to Properties ...Aggregate Line
The figure given below shows the Add Aggregate Line page. The table given below describes different fields present on Add Aggregate Line page. Section Field Description Remark Line Name It allows you to select a name for the Aggregate Line. · Select ...Support Aggregations for Categorical/Dimension Columns in Table
For categorical columns or Dimensions, the aggregation option is available while configuring Table chart. This option is available for getting the aggregated values with Count, Count (Distinct) values for all types of Dimension columns- dataset ...Contextual Data Tooltips
Tooltip configuration allows you to display additional information from the source dataset that is not directly plotted on the chart. This enhances data visibility by providing contextual insights when users hover over chart elements. Overview ...Card Chart Data Labels Datetime formatting
Card chart when plotted with Date/Interval column types with Minimum/Maximum aggregation shows the Minimum/Maximum date out of that column. Default date format is displayed in ISO format. The customization for datetime can be done using the available ...