Bullet Axis
The Bullet Axes formatting option is available in Bullet Axes.
Bullet axes refer to the quantitative scale or the linear X-axis that shows the measures of the variable plotted on it.
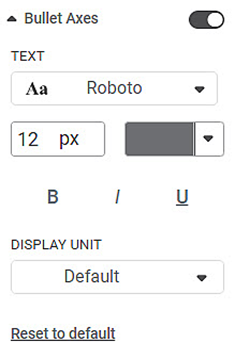
The table given below describes different fields present on Bullet Axes formatting.
Field | Description | Remark |
|---|---|---|
Text | It allows you to change the appearance of the text shown on the X-axis. |
|
Display Unit | It allows you to select the multiples of units in which the variable on the X-axis is measured. | You can select any of the following units
Default indicates that the unit is assigned automatically by parsing the range of the data. That is, Thousands/Millions/Billions/Trillions is automatically assigned based on the data. |
To use Bullet Axes formatting options, first plot a Bullet Chart using the dimensions and measures from the dataset. For example, we plot a Bullet Chart of Count of Cards, Count of Rating, Distinct Count of Income, and Distinct count of Limit against Ethnicity.
The figure given below shows an original image of the Funnel Chart.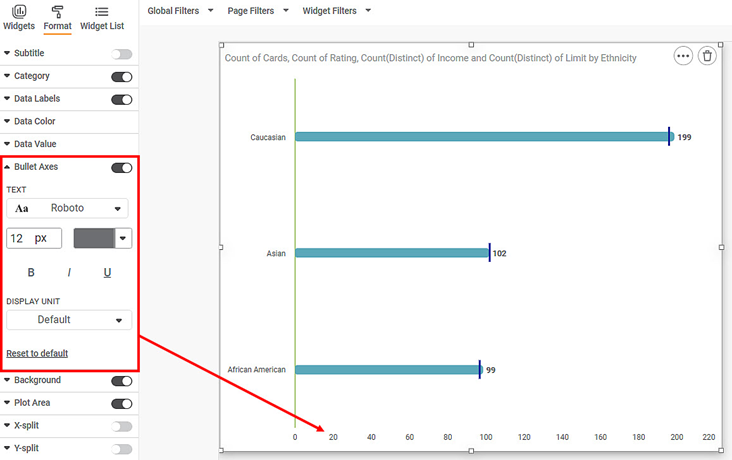
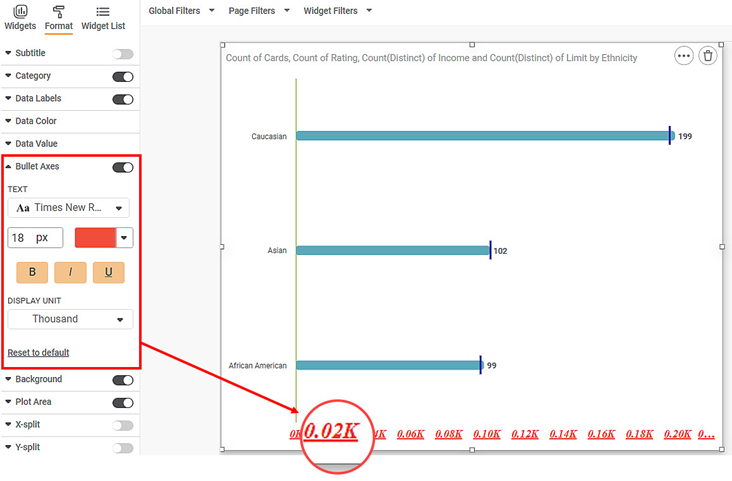
Now, change the Text formatting options. Change the font type, font size, font color, and display unit.
The resultant widget is shown below.
Related Articles
Bullet Axis
The Bullet Axes formatting option is available in Bullet Axes. Bullet axes refer to the quantitative scale or the linear X-axis that shows the measures of the variable plotted on it. The table given below describes different fields present on Bullet ...Axis
Here, the word 'Axis' refers to the X-axis. The figure below shows the various fields present in the Axis formatting in the X-axis. The table given below describes different fields available for Axis formatting for X-axis. Field Description Remark ...Axis Title ( Y-axis)
Axis title is the heading that you want to give to the Y-axis. The table given below describes different fields present on Axis Title formatting in Y-axis. Field Description Remark Text It allows you to give a suitable title to the axis. Axis title ...Axis Label (Y-axis)
Axis Label is the parameter that represents the variable plotted on the Y-axis. The table given below describes different fields present on Axis Label formatting in Y-axis. Field Description Remark Text It allows you to modify the parameters of the ...Axis Title
The Axis title is the heading that you want to give to the X-axis. The table given below describes different fields present on Axis Title formatting in X-axis. Field Description Remark Text It allows you to give a suitable title to the axis. Axis ...