Chi Square Test
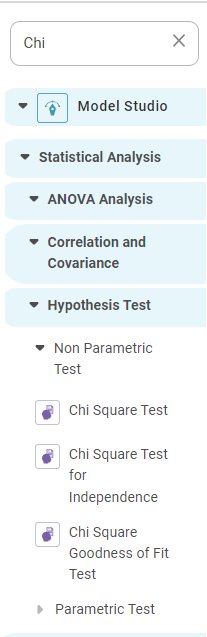
The Chi-Square test is located under Model Studio > Statistical analysis > Hypothesis Test > Non Parametric Test.
Alternatively, use the search bar to find the Chi-Square test feature. Use the drag-and-drop method or double-click to use the algorithm in the canvas. Click the algorithm to view and select different properties for analysis.
Properties of Chi Square Test
The available properties of the Chi Square test are shown below.
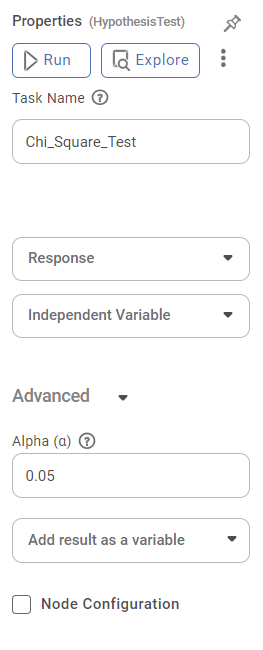
The table below describes the different properties of the Chi Square Test.
Field | Description | Remark |
Run | It allows you to run the node. | – |
Explore | It allows you to explore the successfully executed node. | – |
| Vertical Ellipses | The available options are
| - |
Task Name | It is the name of the task selected on the workbook canvas. |
|
Response | It allows you to select one categorical variable from Dataset. |
|
Independent Variable | It allows you to select one category from the dataset. |
|
Level of Significance | It allows you to set the level of significance. |
|
Add result as a variable | It allows you to use the result in the variables | For more details, refer to Adding Result as a Variable. |
Node Configuration | It allows you to select the instance of the AWS server to provide control over the execution of a task in a workbook or workflow. | For more details, refer to Worker Node Configuration. |
Example of Chi Square Test
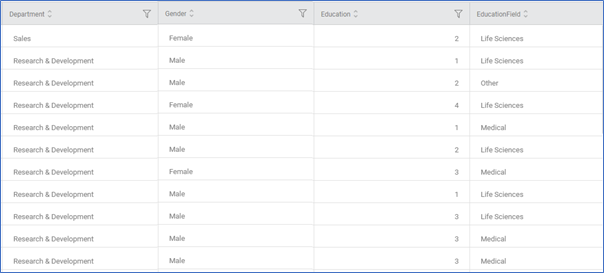
An input data snippet is displayed below.
Property | Value |
Task Name | Chi_Square_Test |
Response | Gender |
Independent Variable | Department |
Alpha | 0.05 |
The result page consists of the following sections.
Frequency Table
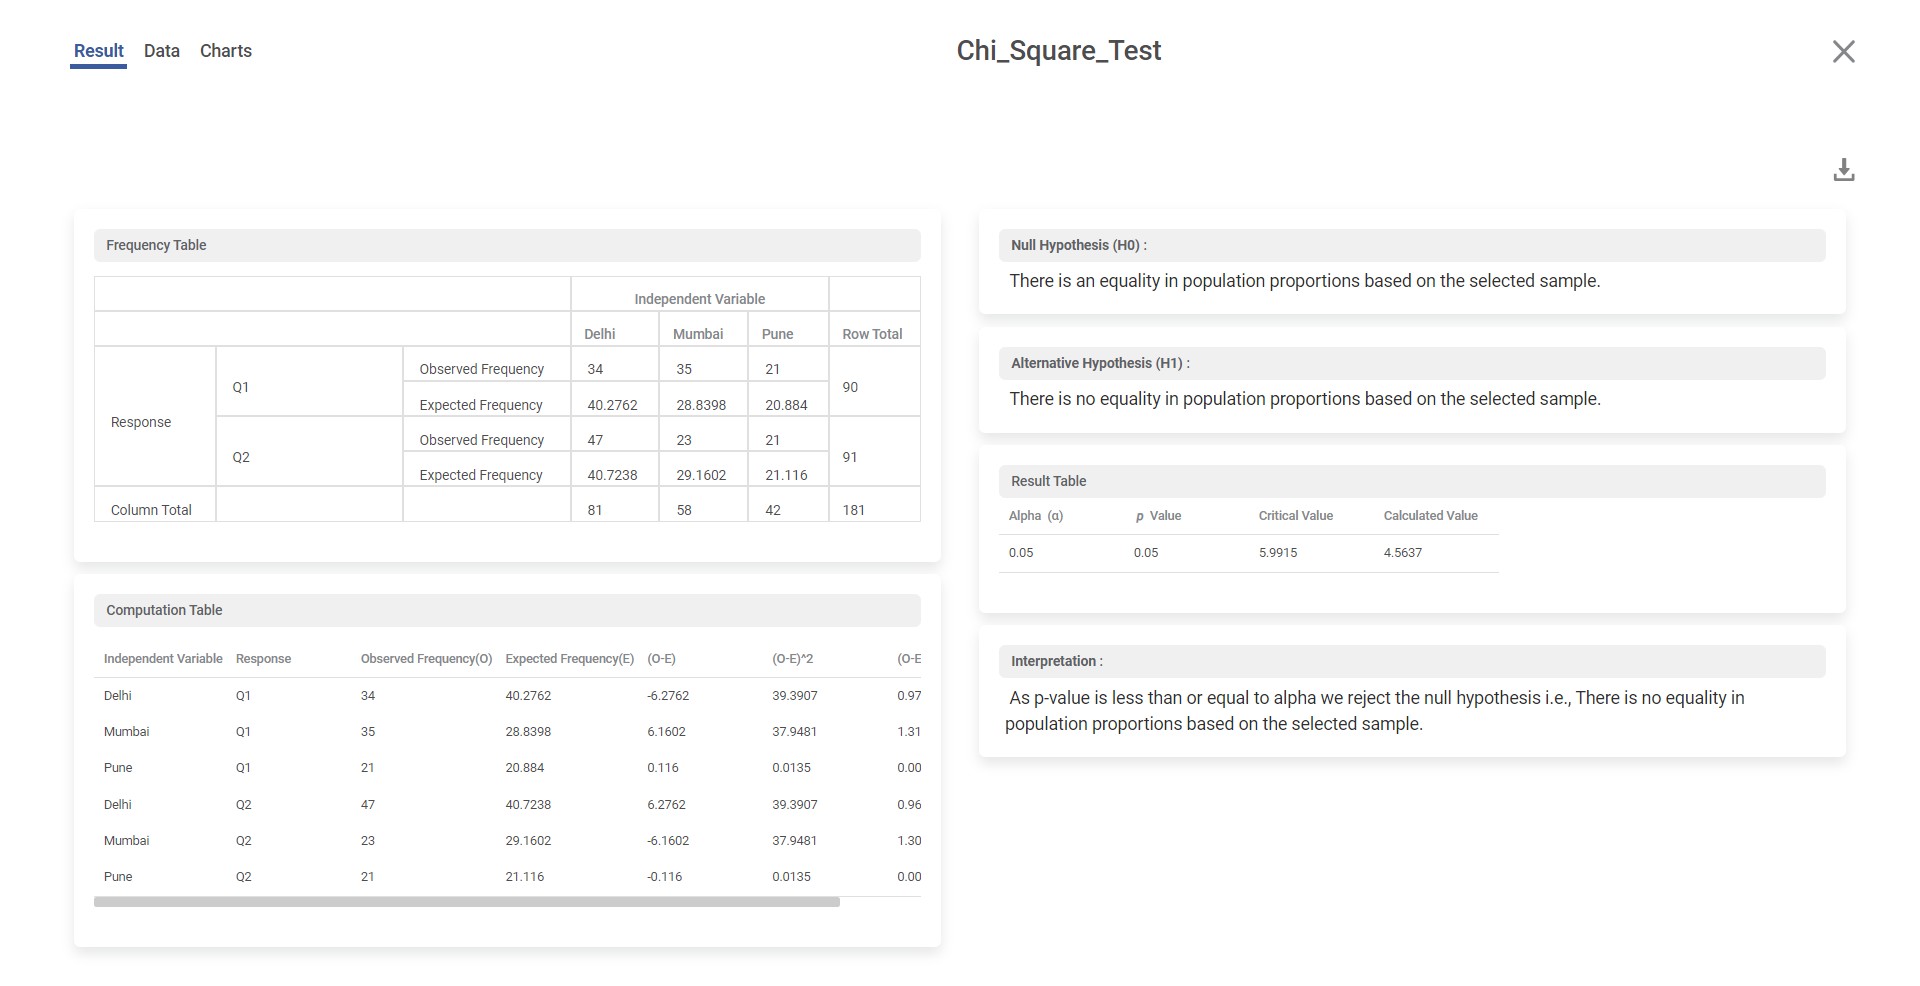
Observed Frequency and Expected Frequency are calculated for each value. Observed Frequency is the number of occurrences found in the sample. The Expected Frequency is calculated as
Expected Frequency = ((Row Total) * (Column Total)) / Total Number of Observations
Computation Table
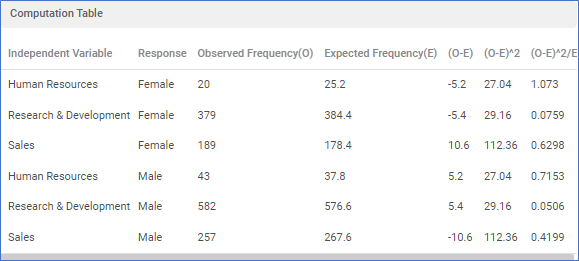
- Independent Variable – in this example department
- Response – Gender
- Observed Frequency (O) – the number of occurrences for the gender, of the department.
- Expected Frequency (E) – calculated as ((Row Total) * (Column Total)) / Total Number of Observations
- Observed Frequency – Expected Frequency (O – E)
- (O – E) ^2
- (O – E) ^2 / E
Hypothesis Interpretation
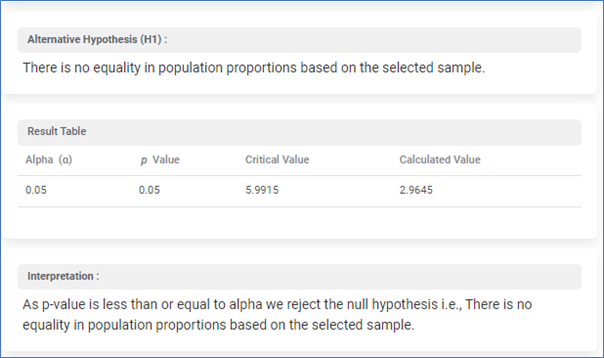
- Null Hypothesis
- Alternative Hypothesis
- Result Value – it consists of Alpha value, p value, Critical value read from Chi-square table, Calculated value for the sample
- Interpretation – Compare the p value with the Alpha value. In this example, the p value is equal to the Alpha value hence the hypothesis is rejected.
Related Articles
Chi Square Test for Independence
Chi Square Test for Independence is located under Model Studio ( ) in Hypothesis Test, in Statistical Analysis, in the left task pane. Use the drag-and-drop method to use the algorithm in the canvas. Click the algorithm to view and select different ...Chi Square Goodness of Fit Test
Chi Square Goodness of Fit Test is located under Model Studio ( ) in Hypothesis Test, in Statistical Analysis, in the left task pane. Use the drag-and-drop method to use the algorithm in the canvas. Click the algorithm to view and select different ...Two Sample Z Test
Two Sample Z Test Description Two sample Z test is a statistical test used to determine whether there is a significant difference between the means of two independent variables. Why to use To compare the means of two independent variables When to use ...Train Test Split
Train Test Split is located under Model Studio () under Sampling in Data Preparation, in the left task pane . Use the drag-and-drop method to use the algorithm in the canvas. Click the algorithm to view and select different properties for analysis. ...Train Test Split
Train Test Split is located under Model Studio ( ) under Sampling in Data Preparation, in the left task pane . Use the drag-and-drop method to use the algorithm in the canvas. Click the algorithm to view and select different properties for analysis. ...