Connectivity Based Clustering
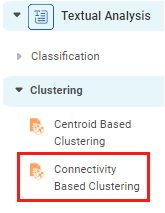
Connectivity Based Clustering is located under Textual Analysis ( ) in Clustering, in the left task pane. Use the drag-and-drop method to use the algorithm in the canvas. Click the algorithm to view and select different properties for analysis.
Refer to Properties of Connectivity Based Clustering.
Properties of Connectivity Based Clustering
The available properties of Connectivity Based Clustering are as shown in the figure given below.
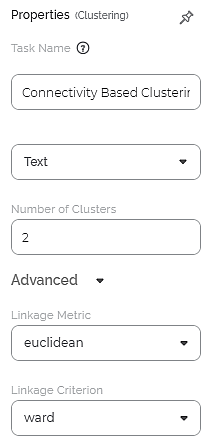
The table given below describes the different fields present on the properties of Connectivity Based Clustering.
Field | Description | Remark | |
| Run | It allows you to run the node. | - | |
| Explore | It allows you to explore the successfully executed node. | - | |
| Vertical Ellipses | It allows you to explore the successfully executed node. | - | |
Task Name | It is the name of the task selected on the workbook canvas. | You can click the text field to edit or modify the name of the task as required. | |
Text | It allows you to select Independent variables. |
| |
Number of Clusters | It allows you to enter the number of clusters you want to create. | The default value is 8. | |
Advanced | Linkage Metric | It allows you to select the metric used to compute the linkage. |
|
Linkage Criterion | It allows you to select the metric used for the merge strategy. | The available options are –
| |
Example of Connectivity Based Clustering
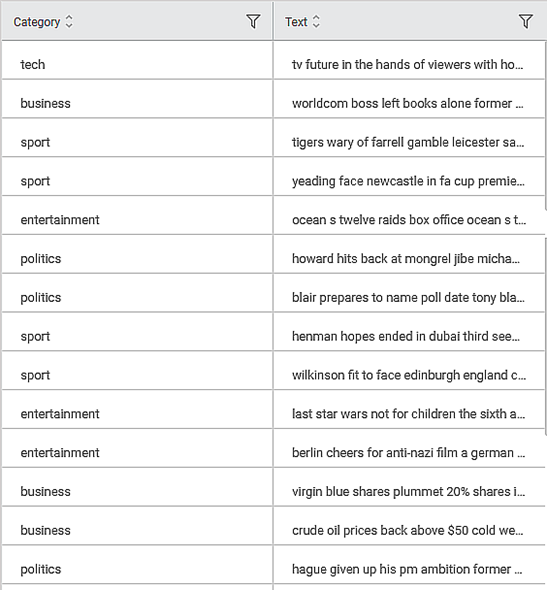
Consider a dataset of musical instruments review. A snippet of input data is shown in the figure given below.
After using the Connectivity Based Clustering, the following results are displayed.
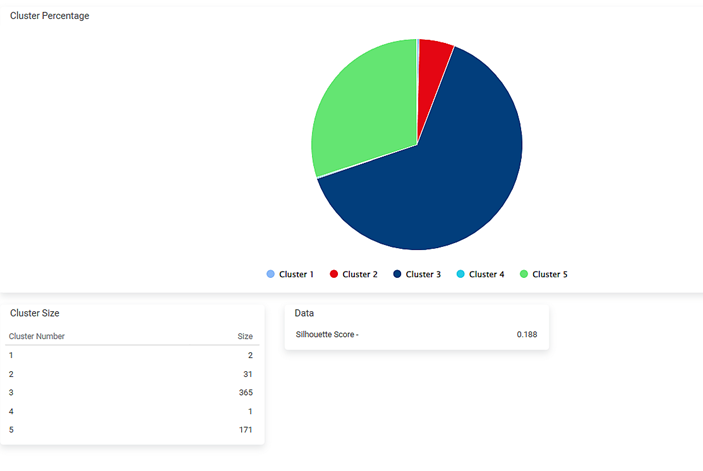
As seen in the above figure, the number of clusters and each cluster's size are displayed along with the Silhouette Score.
Related Articles
Connectivity Based Clustering
Connectivity Based Clustering is located under Textual Analysis ( ) in Clustering, in the left task pane. Use the drag-and-drop method to use the algorithm in the canvas. Click the algorithm to view and select different properties for analysis. Refer ...Density Based Clustering
Density Based Clustering is located under Textual Analysis ( ) in Clustering, in the left task pane. Use the drag-and-drop method to use the algorithm in the canvas. Click the algorithm to view and select different properties for analysis. Refer to ...Centroid Based Clustering
Centroid Based Clustering is located under Textual Analysis () in Clustering, in the left task pane. Use the drag-and-drop method to use the algorithm in the canvas. Click the algorithm to view and select different properties for analysis. Refer to ...Density Based Clustering
Density Based Clustering is located under Textual Analysis ( ) in Clustering, in the left task pane. Use the drag-and-drop method to use the algorithm in the canvas. Click the algorithm to view and select different properties for analysis. Refer to ...Centroid Based Clustering
Centroid Based Clustering is located under Textual Analysis ( ) in Clustering, in the left task pane. Use the drag-and-drop method to use the algorithm in the canvas. Click the algorithm to view and select different properties for analysis. Refer to ...