Covariance
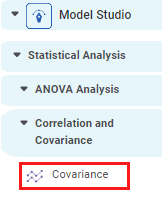
Covariance is located under Model Studio (  ) under Statistical Analysis, in the Correlation and Covariance dropdown, in the left task pane. Use the drag-and-drop method to use the algorithm in the canvas. Click the algorithm to view and select different properties for analysis.
Refer to Properties of Covariance.
Properties of Covariance
The available properties of the Covariance are as shown in the figure given below.
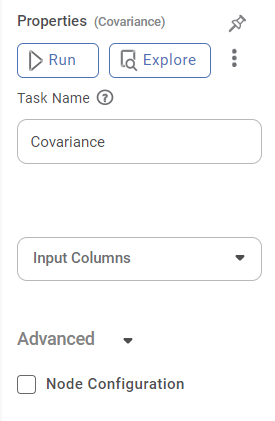
The table below describes the different fields present on the Properties pane of the Covariance.
Field | Description | Remark | |
|---|---|---|---|
| Run | It allows you to run the node. | - | |
| Explore | It allows you to explore the successfully executed node. | - | |
| Vertical Ellipses | The available options are
| - | |
Task Name | It is the name of the task selected on the workbook canvas. | You can click the text field to edit or modify the name of the task as required. | |
Input Column | It allows you to select the variable to be selected as the input attribute. |
| |
Advanced | Node Configuration | It allows you to select the instance of the AWS server to provide control on the execution of a task in a workbook or workflow. | For more details, refer to Worker Node Configuration. |
Example of Covariance
Consider a dataset containing the values for petal and sepal widths and lengths of three different species of plants. A snippet of input data is shown below.
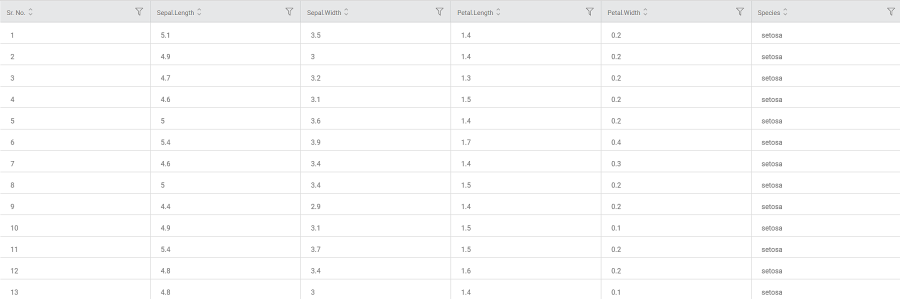
We select the Petal Length, Petal Width, Sepal Length, and Sepal Width as Input Columns.
The Result page of Covariance is displayed below.
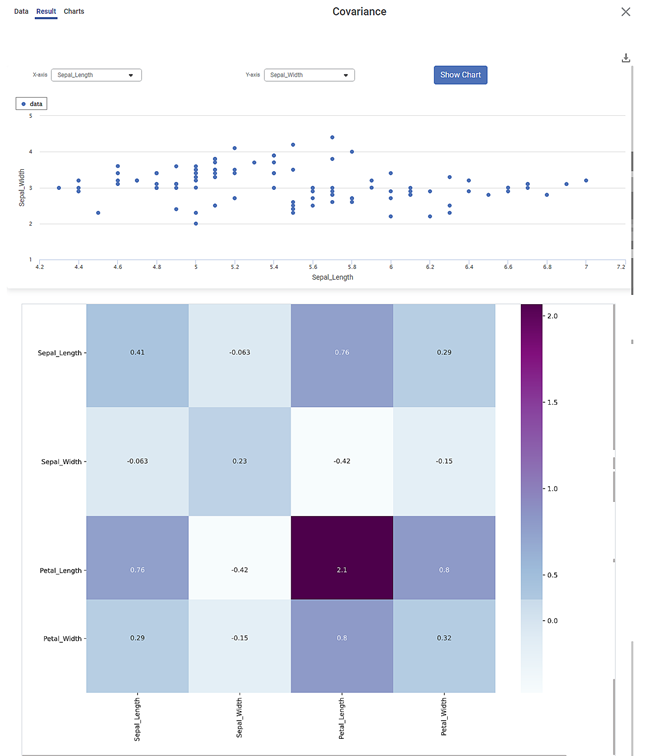
There are two plots on the Result page.
Scatter Plot:
- It shows the variation of one variable with respect to another.
- Select any two different variables for X-axis and Y-axis and click Show Chart to obtain the scatter plot for the selected pair of variables.
- For example, in the figure above, you see the variation of sepal width with sepal length.
- Each dot on the plot is a data point in the dataset.
Heat Map:
- It shows the variance of the mean of each of the four variables (Petal Length, Petal Width, Sepal Length, and Sepal Width) with themselves as well as with each other.
- Each cell lies at the intersection of two of the above variables.
- The number in each cell is the Covariance Score corresponding to the two variables.
- The darker the color of the cell, the higher is the Covariance Score between the two variables.
- For example, the Covariance is maximum for Petal Length with itself, that is 2.1.
- Similarly, you can see that the Covariance Score is 0.8 for the pair Petal Length and Petal Width
- The Data page of Covariance is displayed below.
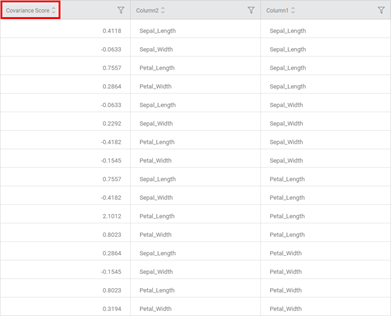
- It shows the Covariance values corresponding to values from Column 2 and Column 3.
- Columns 2 and 3 contain the mean values of the four data columns, that is, Petal Length, Petal Width, Sepal Length, and Sepal Width.
- The same Covariance Scores can be seen on the Heat Map on the Results page.
Related Articles
Pearson Correlation
Pearson Correlation is located under Model Studio >> Statistical Analysis >> Correlation and Covariance Alternatively, use the search bar to find the Pearson Correlation feature. Use the drag-and-drop method or double-click to use the algorithm in ...