Data Joiner
Data Joiner is located under Model Studio (.png) ) in Data Preparation, in the task pane on the left. Use the drag-and-drop method to use the algorithm in the canvas. Click the algorithm to view and select different properties for analysis.
) in Data Preparation, in the task pane on the left. Use the drag-and-drop method to use the algorithm in the canvas. Click the algorithm to view and select different properties for analysis.
Refer to Properties of Data Joiner.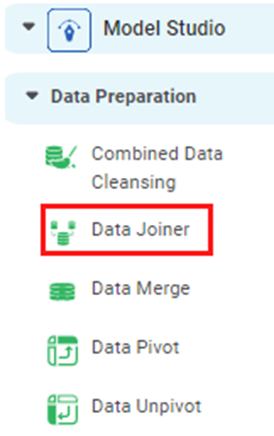
In the Data Joiner algorithm, you can combine two datasets to create one dataset based on certain conditions.
Properties of Data Joiner
The available properties of Data Joiner are as shown in the figure given below.
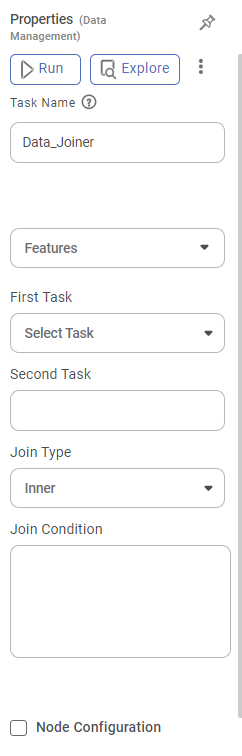
The table given below describes the different fields present on the Properties pane of Data Joiner.
Field | Description | Remark | |
| Run | It allows you to run the node. | - | |
| Explore | It allows you to explore the successfully executed node. | - | |
| Vertical Ellipse | The available options are
| - | |
Task Name | It displays the name of the selected task. | You can click the text field to edit or modify the name of the task as required. | |
Features | It allows you to select the columns that you want to join. |
| |
First Task | It allows you to select the first task from the list of tasks to be joined. | — | |
Second Task | It automatically selects the remaining task as Second Task. | This field is auto-generated. | |
Join Type | It allows you to select the type to join the datasets. | The available Join Types are:
| |
Join Condition | It allows you to apply the condition for joining the datasets. | The data joiner conditions are:
| |
Advanced | Node Configuration | It allows you to select the instance of the AWS server to provide control on the execution of a task in a workbook or workflow. | For more details, refer to Worker Node Configuration. |
Example of Simple Joining Condition
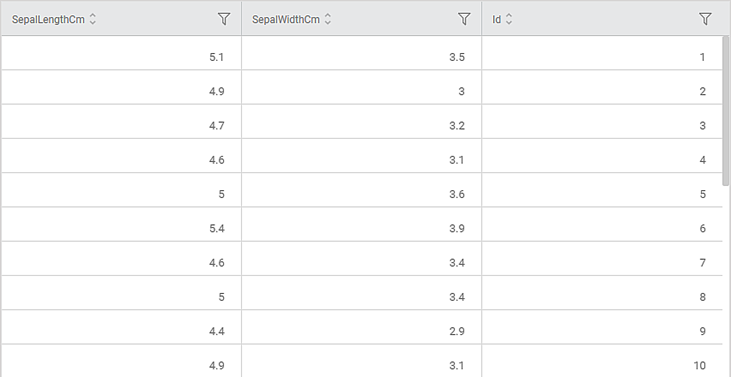
In the example, Iris1 and Iris2 are the two datasets to be joined together.
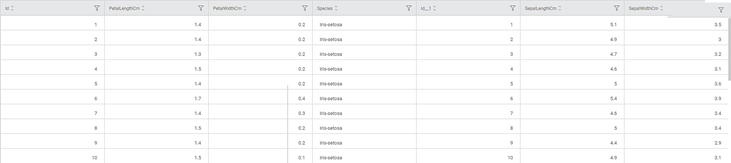
The figure given below displays the input data from Iris_1.
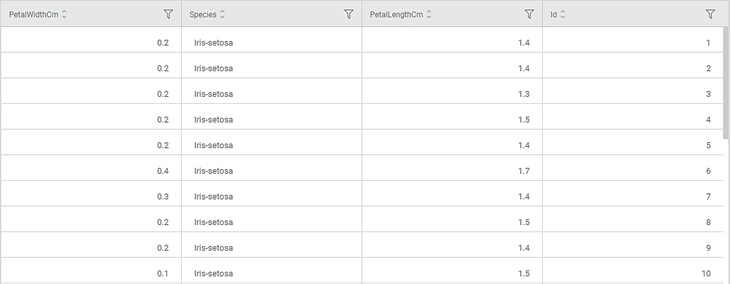
The figure given below displays the input data from Iris_2.
The Simple Join condition is applied to the two datasets. The resultant dataset contains all the columns corresponding to the two input datasets.
The figure given below displays the output data obtained after applying the Inner Joining condition in Simple Join.
Note: | Similarly, you can apply outer joining conditions such as Left Outer, Right Outer, and Full Outer joining conditions in Simple Join Condition to join the datasets. |
Example of Complex Joining Condition
The Complex Data Join condition is applied to the two datasets. The resultant dataset contains all the columns corresponding to the two input datasets. The cells of no data are marked as na.
The figure given below displays the output dataset obtained after applying the Left Outer joining condition in Complex Join.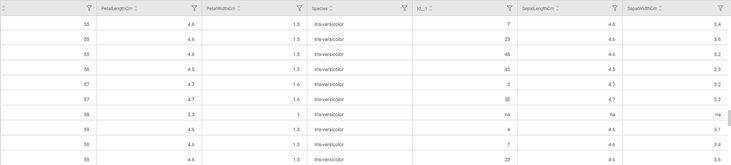
 Note | Similarly, you can apply other joining conditions such as Inner Join, Right Outer, and Full Outer joining conditions in the Complex Join condition to join the datasets. |
Related Articles
Data Joiner
Data Joiner is located under Model Studio ( ) in Data Preparation, in the task pane on the left. Use the drag-and-drop method to use the algorithm in the canvas. Click the algorithm to view and select different properties for analysis. Refer to ...Data Merge
Data Merge is located under Model Studio ( ) in Data Preparation, in the task pane on the left. Use drag-and-drop method to use the algorithm in the canvas. Click the algorithm to view and select different properties for analysis. Properties of Data ...Data Merge
Data Merge is located under Model Studio ( ) in Data Preparation, in the task pane on the left. Use drag-and-drop method to use the algorithm in the canvas. Click the algorithm to view and select different properties for analysis. Properties of Data ...Creating New Data Dictionary
You can create a new data dictionary with the help of existing datasets. It allows you to reuse the datasets and add new features to them while creating a new dataset. To create the new data dictionary, follow the steps given below. On the home page, ...Data Compare
Data Compare is located under Model Studio ( ) in Data Preparation, in the task pane on the left. Use the drag-and-drop method to use the algorithm in the canvas. Click the algorithm to view and select different properties for analysis. In the Data ...