DBSCAN
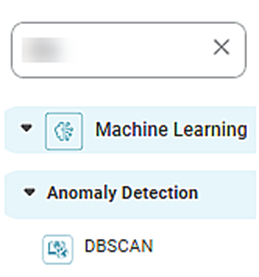
DBSCAN is located under Machine Learning (  ) in Anomaly Detection, in the left task pane. Use the drag-and-drop method to use the algorithm on the canvas. Click the algorithm to view and select different properties for analysis.
Refer to Properties of DBSCAN.
Properties of DBSCAN
The available properties of DBSCAN are shown in the figure below.
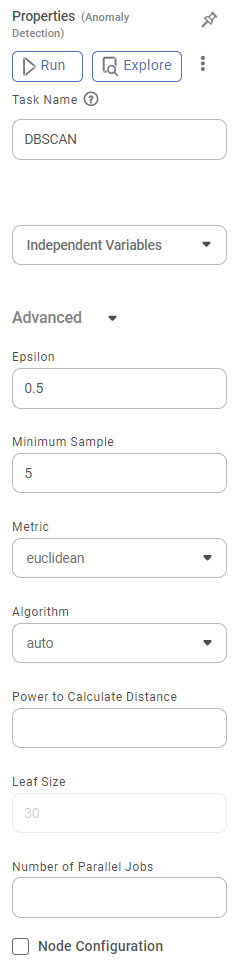
The table below describes different fields present on the properties of DBSCAN.
Field | Description | Remark | |
|---|---|---|---|
| Run | It allows you to run the node. | - | |
| Explore | It allows you to explore the successfully executed node. | - | |
| Vertical Ellipses | The available options are
| - | |
Task Name | It is the name of the task selected on the workbook canvas. | You can click the text field to edit or modify the task's name as required. | |
Independent Variable | It allows you to select the independent variable. |
| |
Advanced | Epsilon | It allows you to select a distance measure at which two data points can be said to be belonging to each other's neighborhood. |
|
Minimum Sample | It allows you to select a minimum number of data points required to form a cluster. |
| |
Metric | It allows you to select a method to determine the distance between two data points belonging to the independent variables. |
| |
Algorithm | It is used to select the algorithm for the Nearest Neighbor module to determine inter-point distances and find the nearest neighbors. |
| |
Power to Calculate Distance | It allows you to select the power used in some of the metrics above. |
| |
Leaf Size | It allows you to select the number of data points associated with a single leaf in the tree. |
| |
Number of Parallel Jobs | It allows you to select the number of concurrently running processes. |
| |
Node Configuration | It allows you to select the instance of the Amazon Web Services (AWS) server to provide control on the execution of a task in a workbook or workflow. | For more details, refer to Worker Node Configuration. | |
Example of DBSCAN
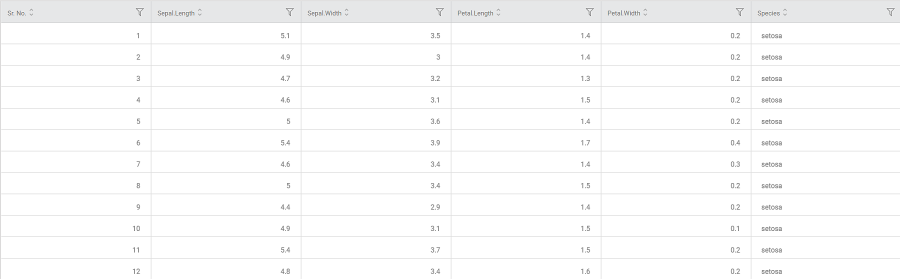
Consider an iris dataset containing several flower species documented according to sepal and petal dimensions like width and length.
A snippet of input data is shown in the figure below.
We select the following properties and apply DBSCAN.
Independent Variables | Sepal Length, Sepal Width, Petal Length, Petal Width |
Epsilon | 0.55 |
Minimum Sample | 5 |
Metric | euclidean |
Algorithm | auto |
Power to Calculate Distance | 2.0 |
Leaf Size | 30 |
Number of Parallel Jobs | 10 |
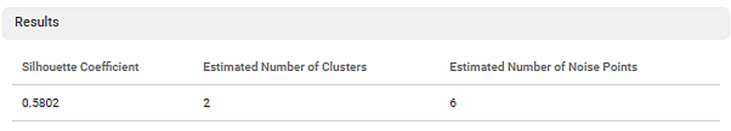
The following parameters calculated by the algorithm are displayed on the Result page.
- Silhouette Coefficient: (0.5802)
Also called the Silhouette score, it indicates the goodness of fit of the DBSCAN technique. Its values range between -1 to 1. The higher the value, the more is the DBSCAN successful in assigning data points to the correct cluster. This also ensures well-defined clusters.
- A value of -1 indicates that data points are wrongly assigned to a cluster.
- A zero value indicates an insignificant or no distance between clusters (overlapping clusters)
- A value of 1 indicates that clusters are significantly separated and can be distinguished.
- Estimated Number of Clusters: (2)
It is the number of clusters created by the DBSCAN technique.
- Estimated Number of Noise Points: (6)
It is the number of outliers (non-clustered data points), which could not be assigned to any of the clusters.
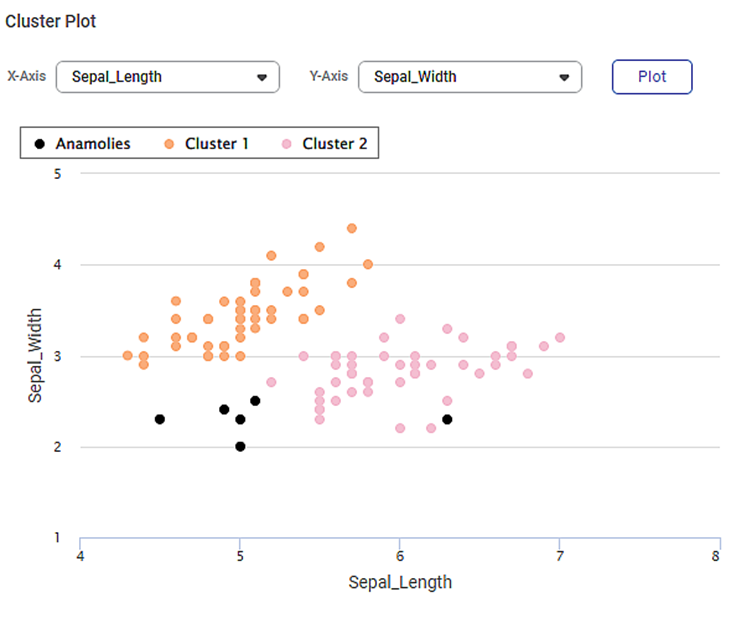
On the same result page, you also see the cluster plot between different sets of variables. By default, the first two variables in the dataset are selected for the Cluster Plot. For example, in the image below, you see a cluster plot of sepal width against sepal length.
- You can change the variables from X-axis and Y-axis drop-downs and plot different cluster plots. (You should select different variables for both axes.)
- The data points belonging to different clusters and the noise points are identified using different colors.
- You can hover over any data point to determine its coordinates.
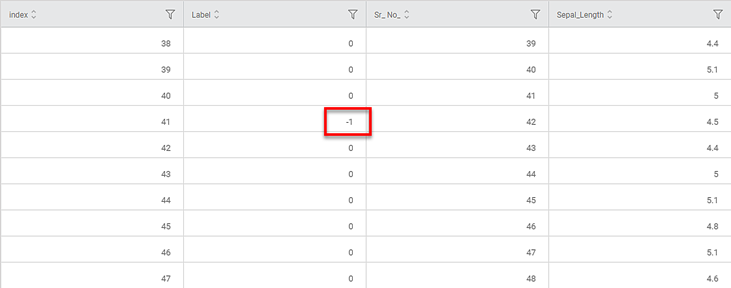
The figure below shows the resultant dataset in the Data tab.
- Along with the columns present in the original dataset, you can see the ID and Label columns added.
- In the Label column,
- A zero value (0) indicates that the data point is assigned to any one of the clusters
- A value of -1 indicates that the point is an outlier or a noise point.