Decision Tree
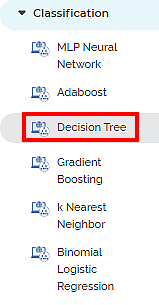
Decision Tree is located under Machine Learning (  ) in Classification, in the task pane on the left. Use drag-and-drop method to use the algorithm in the canvas. Click the algorithm to view and select different properties for analysis.
Refer to Properties of Decision Tree.
Properties of Decision Tree
The available properties of Decision Tree are as shown in the figure given below.
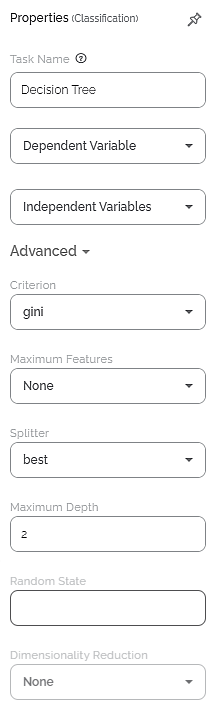
The table given below describes the different fields present in the properties of Decision Tree.
Field | Description | Remark |
|---|---|---|
| Run | It allows you to run the node. | - |
| Explore | It allows you to explore the successfully executed node. | - |
| Vertical Ellipses | The available options are
| - |
Task Name | It displays the name of the selected task. | You can click the text field to edit or modify the name of the task as required. |
Dependent Variable | It allows you to select the dependent variable. | Any one of the available categorical variables can be selected. |
Independent Variable | It allows you to select the experimental or predictor variable(s)— . |
|
Criterion | It allows you to select the Decision-making criterion to be used. | Values are: entropy and gini. |
Maximum Features | Auto, sqrt, log2, None | |
Splitter | It allows you to select the criterion for feature selection. | Values are: Best - It selects the most relevant features of the dataset. Random - It selects random features of the dataset. |
Maximum Depth | It allows you to set the depth of the decision tree. | The more the depth of the tree, the more accurate the prediction. However, more depth also takes more time and computation power. So, it is advisable to choose an optimum depth. |
Random State | ||
Dimensionality Reduction | It is the process of reducing the number of input variables. | The values are:
|
Related Articles
Decision Tree Regression
Decision Tree Regression is located under Machine Learning ( ) > Regression > Decision Tree Regression Use the drag-and-drop method (or double-click on the node) to use the algorithm in the canvas. Click the algorithm to view and select different ...Classification
Notes: The Reader (Dataset) should be connected to the algorithm. Missing values should not be present in any rows or columns of the reader. To find out missing values in a data, use Descriptive Statistics. Refer to Descriptive Statistics. If missing ...Random Forest Regression
Random Forest Regression is located under Machine Learning ( ) > Regression > Random Forest Regression Use the drag-and-drop method (or double-click on the node) to use the algorithm in the canvas. Click the algorithm to view and select different ...Model Compare
Working with Model Compare To start working with Model Compare, follow the steps given below. Go to the Home page and create a new workbook or open an existing workbook. Drag and drop the required dataset on the workbook canvas. In the Properties ...Using While Condition
To use the While condition, follow the steps given below. Open the required workbook or create a new workbook. The selected workbook canvas is displayed. Add the reader/dataset if not already present in your workbook. Drag-and-drop or double-click ...