Density Based Clustering
Density Based Clustering is located under Textual Analysis (  ) in Clustering, in the left task pane. Use the drag-and-drop method to use the algorithm in the canvas. Click the algorithm to view and select different properties for analysis.
Refer to Properties of Density Based Clustering.
Properties of Density Based Clustering
The available properties of Density Based Clustering are as shown in the figure given below.
The table given below describes the different fields present on the properties of Density Based Clustering.
Field | Description | Remark | |
| Run | It allows you to run the node. | - | |
| Explore | It allows you to explore the successfully executed node. | - | |
| Vertical Ellipses | The available options are
| - | |
Task Name | It is the name of the task selected on the workbook canvas. | You can click the text field to edit or modify the name of the task as required. | |
Text | It allows you to select Independent variables. |
| |
Advanced | Epsilon | It allows you to enter the maximum distance between two data points for them to be considered in the neighborhood of each other. | The default value is 0.5 |
Minimum Number of Samples | It allows you to enter the minimum number of samples to be considered while assigning clusters. | The default value is 10. | |
Algorithm | It allows you to select the algorithm to be used for searching the nearest neighbor while assigning clusters. | The available options are –
| |
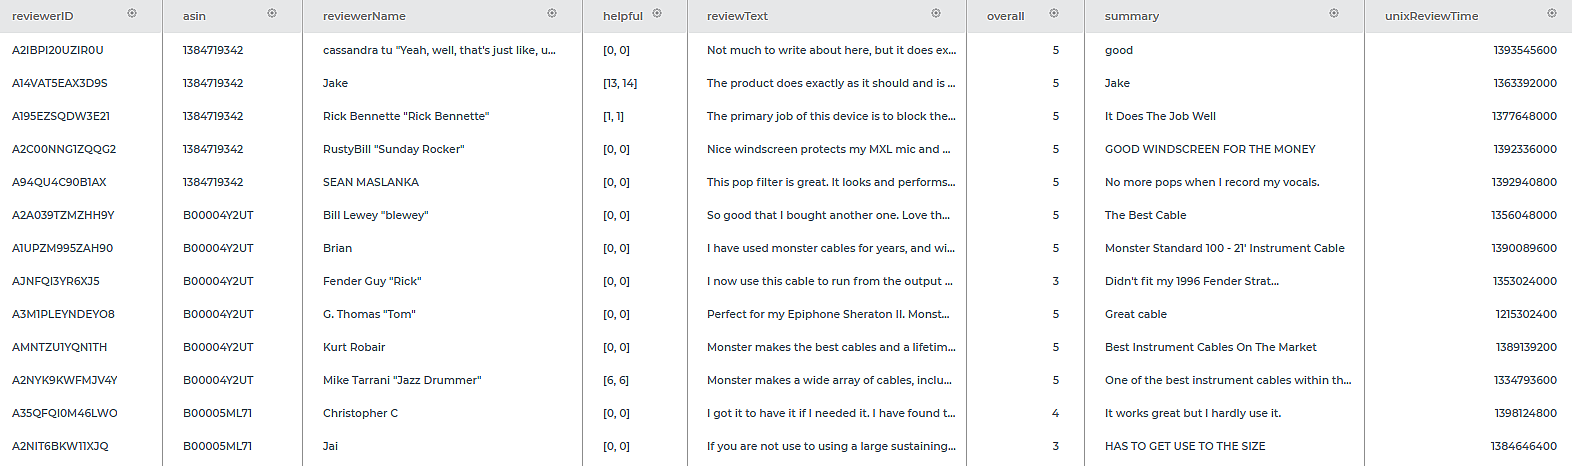
Example of Density Based Clustering
Consider a dataset of Musical Instruments review. A snippet of input data is shown in the figure given below.
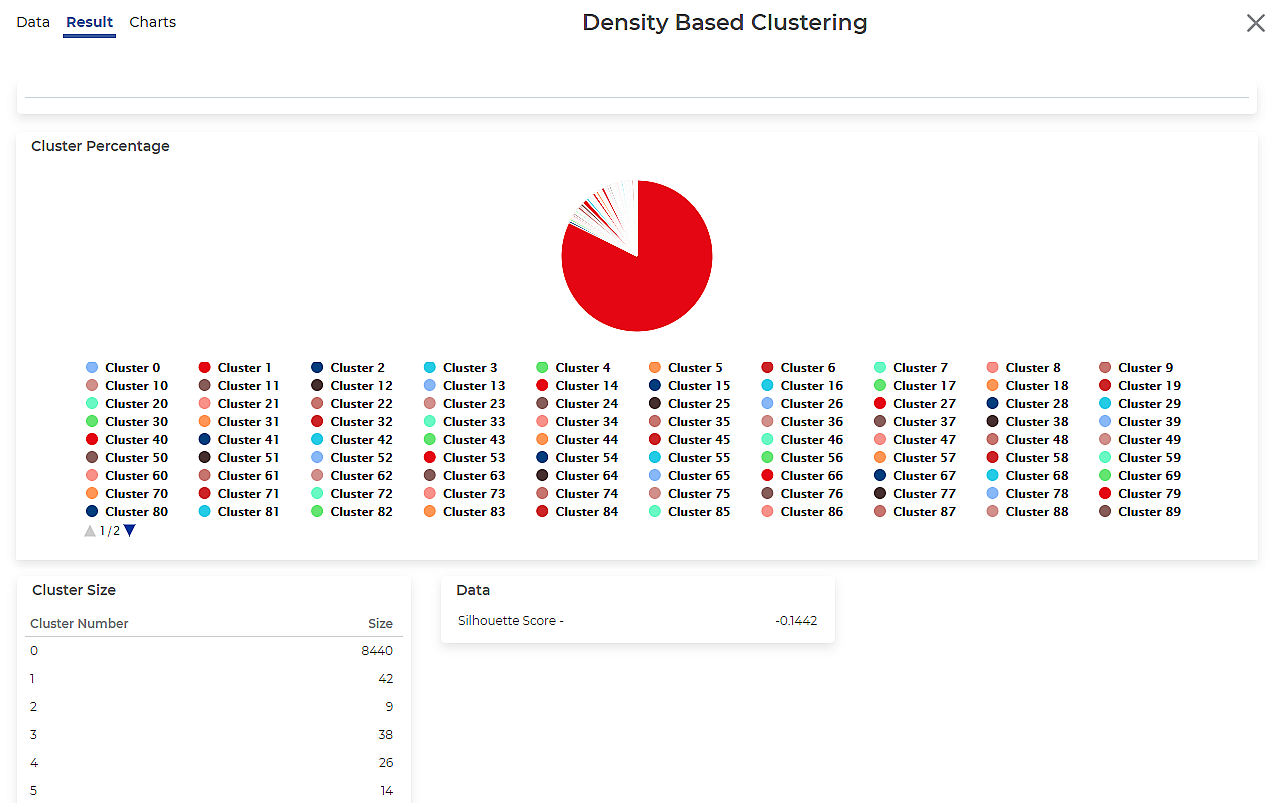
After using the Density Based Clustering, the following results are displayed.
Related Articles
Density Based Clustering
Density Based Clustering is located under Textual Analysis ( ) in Clustering, in the left task pane. Use the drag-and-drop method to use the algorithm in the canvas. Click the algorithm to view and select different properties for analysis. Refer to ...Centroid Based Clustering
Centroid Based Clustering is located under Textual Analysis () in Clustering, in the left task pane. Use the drag-and-drop method to use the algorithm in the canvas. Click the algorithm to view and select different properties for analysis. Refer to ...Connectivity Based Clustering
Connectivity Based Clustering is located under Textual Analysis ( ) in Clustering, in the left task pane. Use the drag-and-drop method to use the algorithm in the canvas. Click the algorithm to view and select different properties for analysis. Refer ...Centroid Based Clustering
Centroid Based Clustering is located under Textual Analysis ( ) in Clustering, in the left task pane. Use the drag-and-drop method to use the algorithm in the canvas. Click the algorithm to view and select different properties for analysis. Refer to ...Connectivity Based Clustering
Connectivity Based Clustering is located under Textual Analysis ( ) in Clustering, in the left task pane. Use the drag-and-drop method to use the algorithm in the canvas. Click the algorithm to view and select different properties for analysis. Refer ...