Descriptive Statistics
Descriptive Statistics is located under Model Studio in Data Preparation, in the task pane on the left. Use drag-and-drop method to use algorithm in the canvas. Click the algorithm to view and select different properties for analysis.
Refer to Properties of Descriptive Statistics.
Properties of Descriptive Statistics
The table given below describes different fields present on properties of Descriptive Statistics.
Field | Description | Remark | |
|---|---|---|---|
| Run | It allows you to run the node. | - | |
| Explore | It allows you to explore the successfully executed node. | - | |
| Vertical Ellipses | The available options are
| - | |
Task Name | It displays the name of the selected task. | You can click the text field to edit or modify the name of the task as required. | |
Features | It allows you to select the features for which you want to get statistical information. |
| |
| Advanced | Node Configuration | It allows you to select the instance of the AWS server to provide control on the execution of a task in a workbook or workflow. | For more details, refer to Worker Node Configuration. |
Interpretation from Descriptive Statistics
The figure given below displays the output of descriptive statistics used on sample data.
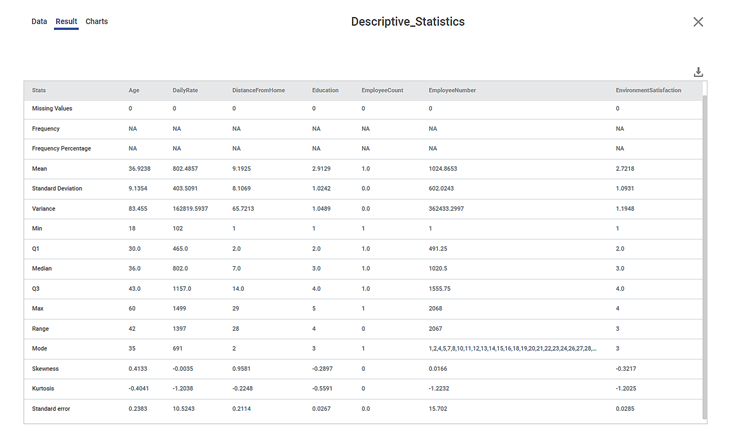
The table given below describes the result for Descriptive Statistics.
Descriptive Statistic | Result | Remark |
|---|---|---|
Total No. of Observations | It provides the total number of observations present in the dataset | It is the total count of the number of rows. |
Missing | It shows the number of missing values present in the selected features. | You cannot build some models if data contains missing values. |
Frequency | It provides the frequency of the number of times the data has occurred. | It is calculated only for categorical datatype. |
Frequency Percentage | It provides the frequency percentage of the number of times the data has occurred. | It is calculated only for categorical datatype. |
Mean | It provides average of the selected features. | It is calculated only for numerical datatype. |
Standard Deviation | It measures the dispersion of a dataset relative to its mean. |
|
Variance | It measures how far a set of numbers are spread out from their average value. |
|
Min | It provides the minimum value for the selected features. | It is calculated only for numerical datatype. |
Q1 | It provides the 25th percentile of the data. |
|
Median (Q2) | It provides the middle value for the selected features. |
|
Q3 | It provides the 75th percentile of the data. |
|
Max | It provides the maximum value for the selected features. | It is calculated only for numerical datatype. |
Range | It is the difference between maximum and minimum value. | It is calculated only for numerical datatype. |
Mode | It provides the value that has occurred maximum times. |
|
Skewness | It provides the distribution of data points.
|
In other words,
|
Kurtosis | It identifies whether the tails of a given distributed data contain extreme values. |
|
Standard error | It represents the standard deviation of the mean within a dataset. It provides a measurement for the spread of data. |
|
Related Articles
Descriptive Statistics
Descriptive Statistics is located under Model Studio ( ) in Data Preparation, in the task pane on the left. Use drag-and-drop method to use algorithm in the canvas. Click the algorithm to view and select different properties for analysis. Refer to ...Classification
Notes: The Reader (Dataset) should be connected to the algorithm. Missing values should not be present in any rows or columns of the reader. To find out missing values in a data, use Descriptive Statistics. Refer to Descriptive Statistics. If missing ...Parametric Distribution Fitting
Parametric Distribution Fitting is located under Model Studio ( ) in Statistical Analysis, in the left task pane. Use the drag-and-drop method to use the algorithm in the canvas. Click the algorithm to view and select different properties for ...Profile
Overview: The Profile node provides statistical summaries and visual insights for selected columns in a dataset. It helps users understand distributions, missing values, and basic metrics before further transformations. Location: Pipeline → Data ...Basic Statistic
In Rubithings, after commissioning a thing, the basic statistics can be viewed by clicking on the thing. There are three types of data gadgets present. Field Description Live data It visualizes the live data Statistics It gives the basic statistics ...