Exporting Chart and Chart Data
Exporting charts and data helps you store/save them in your device or on the cloud. You can then share or view the chart in PDF format and data in CSV format.
Exporting Chart in PDF
To export the chart, follow the steps given below.
- Create the number of charts as required. Refer to Creating Charts using Widgets.
- Select the widget that you want to export.
- On the top right corner of the widget, click the More Options ellipsis (
 ).
).
The available options are displayed. - Click the Export Chart In PDF option.
The selected widget is saved as a PDF file in your default download folder.
Exporting Data in CSV/Excel
To export data, follow the steps given below.
- Create the number of charts as required. Refer to Creating Charts using Widgets.
- Select the widget from which you want to export data.
- On the top right corner of the widget, click the More Options ellipsis ( ).
The available options are displayed.
To export data, you get 2 options: Export Data to CSV or Export Data to Excel. You can select any option as per the file you want- CSV or Excel (.xlsx).
- Click the Export Data In CSV
The data of the selected widget is saved as a CSV file in your default download folder.
For example, we plot a Column Chart of the Maximum of Sales by Order Priority in a sales dataset, as shown below.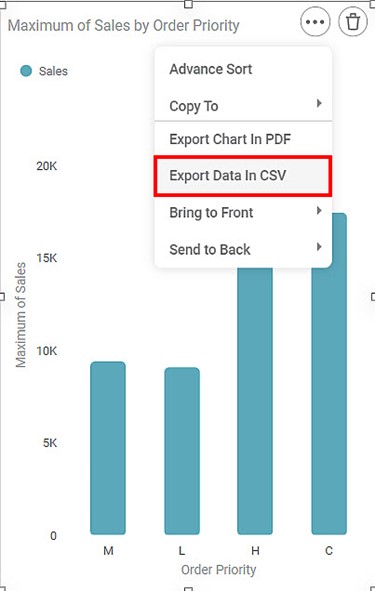
A snippet of the data stored in the CSV file for the above Column Chart is shown below. 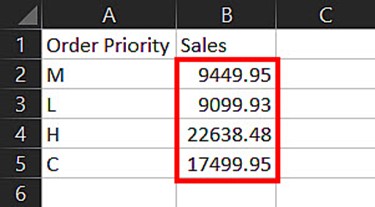
Now, let’s sort the widget by arranging the Maximum of Sales in the Ascending Order. The resultant widget is as shown below.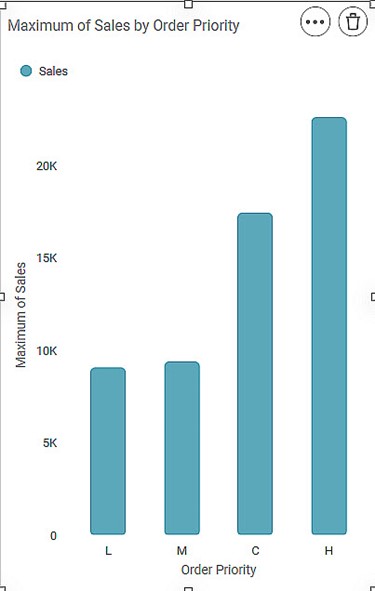
Now, we export the data from the sorted chart as CSV. A snippet of the data is shown below.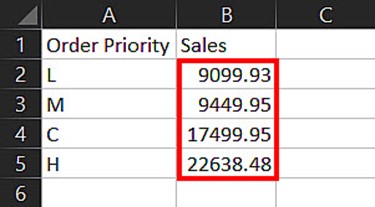
You can see that the data in the new CSV file is also arranged in the same order as the chart, that is, Ascending order.
You can select option of 'Export Data to Excel' to generate the excel sheet.
Notes: |
|
Related Articles
Contextual Data Tooltips
Tooltip configuration allows you to display additional information from the source dataset that is not directly plotted on the chart. This enhances data visibility by providing contextual insights when users hover over chart elements. Overview ...Exporting a Dashboard
Exporting a dashboard helps you to store/save the dashboard on the system. You can then share or view the dashboard in PDF and PPT format. When you export a dashboard, all the pages present in the dashboard are exported. To export a dashboard, follow ...Exporting a Project
Exporting a project is saving the project on your system. The exported project is saved in a .DAT file format. This project can be used again by importing it into rubiscape. Note: Make sure you are in the correct Workspace, which includes the project ...Card Chart Data Labels Datetime formatting
Card chart when plotted with Date/Interval column types with Minimum/Maximum aggregation shows the Minimum/Maximum date out of that column. Default date format is displayed in ISO format. The customization for datetime can be done using the available ...Exporting Data Dictionary
You can export the data dictionary to save it to your computer. To export a data dictionary, follow the steps given below. Open the workspace that includes your data dictionary. Refer to Changing Workspace. On the home page, click Datasets. Recent ...