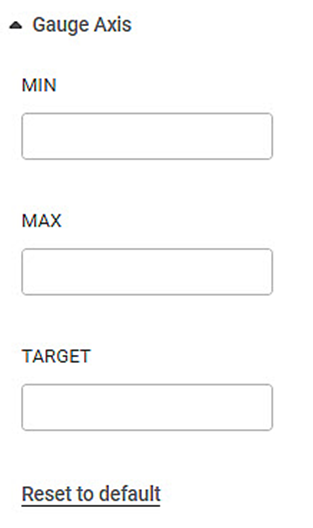
Gauge Axis
The Gauge Axis formatting option is available in the Solid Gauge Chart.
This allows you to select the Minimum, Maximum, and Target values for the chart.
Note: | These options are visible only if Min/Max/Target are not selected in the Widget Configuration. You can enter custom values here once they appear. |
The table given below describes different fields present for Gauge Chart formatting.
Field | Description | Remark |
|---|---|---|
Minimum | The minimum value to be plotted for the Gauge Chart. | — |
Maximum | The maximum value to be plotted for the Gauge Chart. | — |
Target | The Target value is for comparing how far along the actual value has reached on the scale as compared to the target value. | — |
To use Gauge Axis formatting options, first plot a Solid Gauge using the dimensions and measures from the dataset. But do not select Minimum, Maximum, and Target values in the Widget configuration. For example, we plot a Solid Gauge Chart of the Income.
The figure given below shows an original image of the Solid Gauge Chart.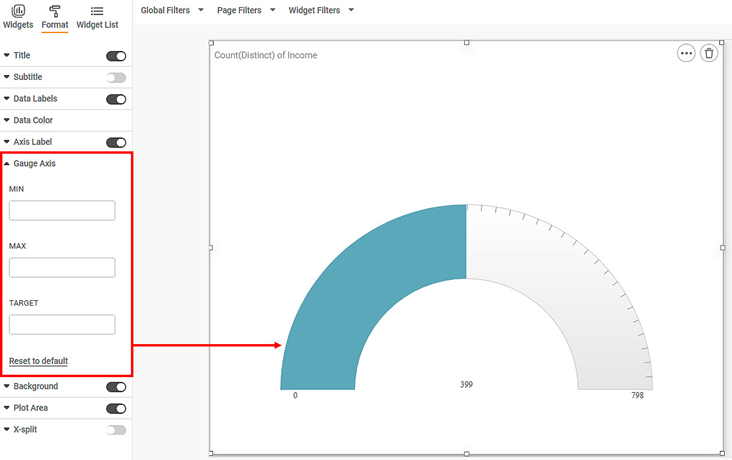
Now,
- Enter MIN value
- Enter MAX value
- Enter TARGET value
Notes: |
|
The resultant widget is shown below.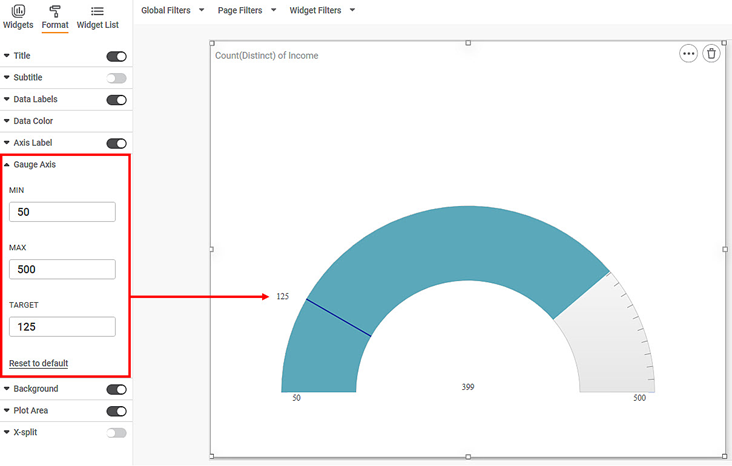
Related Articles
Axis
Here, the word 'Axis' refers to the X-axis. The figure below shows the various fields present in the Axis formatting in the X-axis. The table given below describes different fields available for Axis formatting for X-axis. Field Description Remark ...Axis Title ( Y-axis)
Axis title is the heading that you want to give to the Y-axis. The table given below describes different fields present on Axis Title formatting in Y-axis. Field Description Remark Text It allows you to give a suitable title to the axis. Axis title ...Axis Label (Y-axis)
Axis Label is the parameter that represents the variable plotted on the Y-axis. The table given below describes different fields present on Axis Label formatting in Y-axis. Field Description Remark Text It allows you to modify the parameters of the ...Axis Title
The Axis title is the heading that you want to give to the X-axis. The table given below describes different fields present on Axis Title formatting in X-axis. Field Description Remark Text It allows you to give a suitable title to the axis. Axis ...Axis Label
This formatting option allows you to make the following changes to the Axis Label. You can change the text font and also its size and color. You can make the text bold, italic, and underline it. Axis Label is the parameter that represents the ...