K Nearest Neighbour
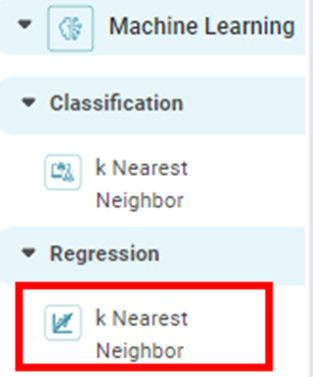
k Nearest Neighbor Regression is located under Machine Learning ( ) in Regression, in the left task pane. Use the drag-and-drop method to use the algorithm in the canvas. Click the algorithm to view and select different properties for analysis.
Refer to Properties of k Nearest Neighbor Regression.
Properties of k Nearest Neighbor Regression
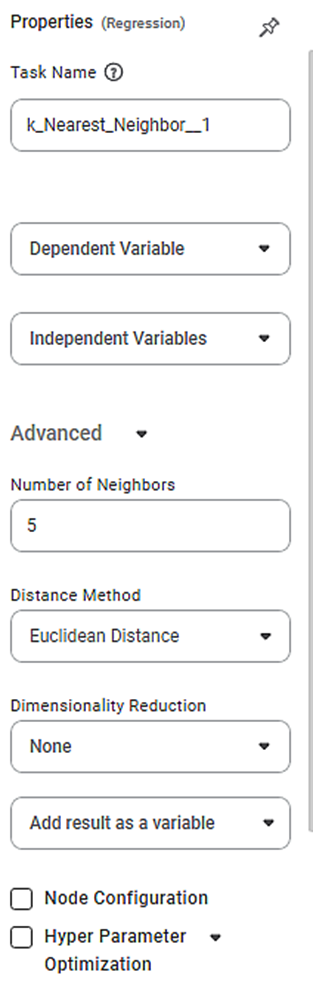
The available properties of k Nearest Neighbor Regression are as shown in the figure given below.
The table given below describes the different fields present on the properties of Lasso Regression.
Field | Description | Remark | |
| Run | It allows you to run the node. | - | |
| Explore | It allows you to explore the successfully executed node. | - | |
| Vertical Ellipses | The available options are
| - | |
Task Name | It is the name of the task selected on the workbook canvas. | You can click the text field to edit or modify the name of the task as required. | |
Dependent Variable | It allows you to select the dependent variable. | You can select only one variable, and it should be of numeric type. | |
Independent Variables | It allows you to select Independent variables. |
| |
Advanced | Number of Neighbors | It allows you to enter the number of neighboring data points to be checked. | The default value is 5. |
Distance Method | It allows you to select the method to calculate the distance between two data points. | The available options are -
| |
Dimensionality Reduction | It allows you to select the dimensionality reduction method. |
| |
Example of k Nearest Neighbor Regression
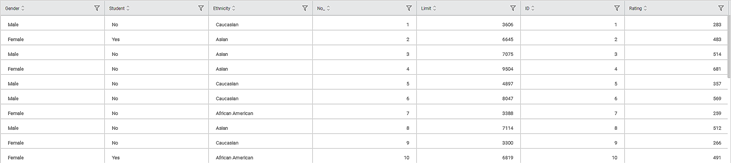
Consider a Credit Card Balance dataset of people of different gender, age, education, and so on. A snippet of input data is shown in the figure given below.
The table below describes the performance metrics on the result page.
| Performance Metric | Descripton | Remark |
RMSE (Root Mean Squared Error) | It is the square root of the averaged squared difference between the actual values and the predicted values. | It is the most commonly used performance metric of the model. |
R Square | It is the statistical measure that determines the proportion of variance in the dependent variable that is explained by the independent variables. | Value is always between 0 and 1. |
Adjusted R Square | It is an improvement of R Square. It adjusts for the increasing predictors and only shows improvement if there is a real improvement. | Adjusted R Square is always lower than R Square. |
AIC (Akaike Information Criterion) | AIC is an estimator of errors in predicted values and signifies the quality of the model for a given dataset. | A model with the least AIC is preferred. |
BIC | BIC is a criterion for model selection amongst a finite set of models. | A model with the least BIC is preferred. |
| MSE (Mean Squared Error) | It is the averaged squared difference between the actual values and the predicted values. | A model with low MSE is preferred. |
| MAE (Mean Absolute Error) | It the absolute value of difference between actual and predicted values | A model with low MAE is preferred. |
| MAPE ( Mean Absolute Percentage Error) | it is the average magnitude of error produced by a model, or how far off predictions are on average. | A model with low MAPE is preferred |
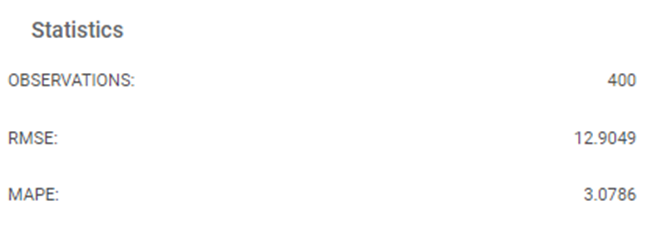
As seen in the above figure, the values for different parameters are –
Related Articles
Classification
Notes: The Reader (Dataset) should be connected to the algorithm. Missing values should not be present in any rows or columns of the reader. To find out missing values in a data, use Descriptive Statistics. Refer to Descriptive Statistics. If missing ...Canvas-level Validation
Workbook The canvas-level validation error is displayed for a workbook for any of the following: The nodes on the canvas are not interconnected. The nodes on the canvas are interconnected. The error, in this case, occurs for any one of the following: ...Canvas-level Validation
Workbook The canvas-level validation error is displayed for a workbook for any of the following: The nodes on the canvas are not interconnected. The nodes on the canvas are interconnected. The error, in this case, occurs for any one of the following: ...Decimal Place Formatter
Formatting a Table You can format the tables that appear in various charts. Tables can be plotted standalone like Table and Cross Table, or they accompany other charts (like Sparkline Chart in which they accompany a Line, Area, or Column Chart). The ...Comma Format Options in Number Formatting
Overview Comma Format options allow users to display numbers based on region-specific digit grouping and separators. These options are available under the Comma Format dropdown and are enabled only when comma formatting is turned ON. Supported across ...