Kruskal Wallis Test
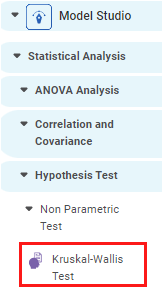
In the left task pane, Kruskal-Wallis is located under Model Studio ( ) in Statistical Analysis inside Hypothesis Test under Non Parametric Test. Use the drag-and-drop method to use the algorithm in the canvas. Click the algorithm to view and select different properties for analysis. Refer to Properties of Kruskal Wallis Test.
The test calculates the p value. Compare this p value with the alpha value to conclude hypothesis testing. Reject the hypothesis if the p value is less than alpha.
The test also calculates and displays the H-statistics. H-statistics calculates the interaction strength between the two features.
Properties of Kruskal-Wallis Test
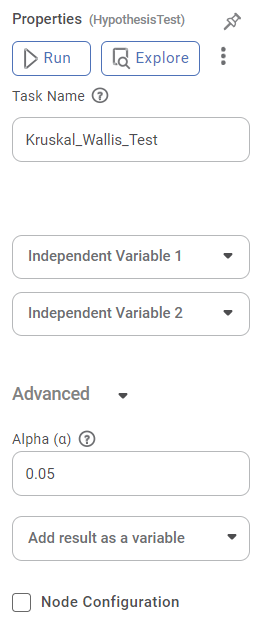
The available properties of the Kruskal-Wallis test are shown below.
The table below describes the different properties of Kruskal-Wallis.
Field | Description | Remark | |
|---|---|---|---|
| Run | It allows you to run the node. | - | |
| Explore | It allows you to explore the successfully executed node. | - | |
| Vertical Ellipses | The available options are
| - | |
Task Name | It is the name of the task selected on the workbook canvas. |
| |
Features | It allows you to select the variables on which the test is applied. | You need to choose a minimum of two variables. | |
Advanced | Alpha | It allows you to enter the Alpha value, a significance level. |
|
Node Configuration | It allows you to select the instance of the AWS server to provide control over the execution of a task in a workbook or workflow. | For more details, refer to Worker Node Configuration. | |
Example of Kruskal-Wallis
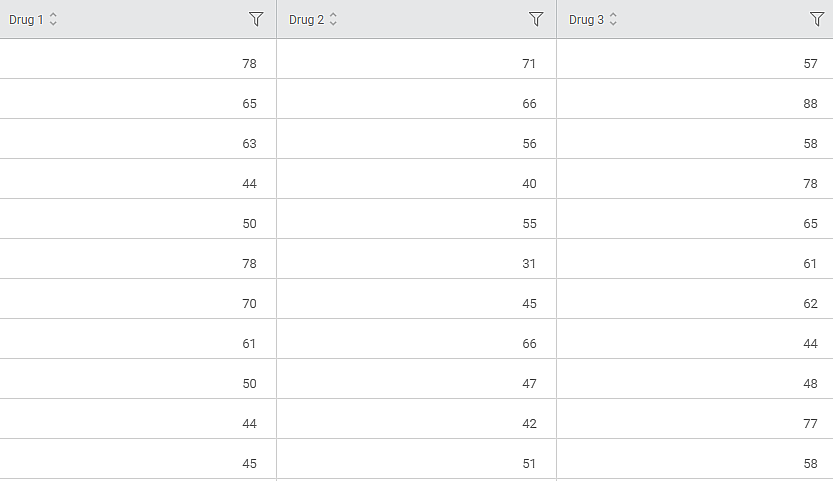
As a medical researcher, you want to compare the effectiveness of three independent drugs – Drug A, Drug B, or Drug C. You run a Kruskal Wallis test to compare the efficacy of the drug treatments. Drug 1, Drug 2, and Drug 3 observations are given below.
The Kruskal-Wallis test is applied to the input data by selecting three independent columns. The chosen values are given below.
Property | Value |
Task Name | Kruskal_Wallis_Test |
Features (Independent Variable) | Drug 1, Drug 2, Drug 3 |
Alpha | 0.05 |
The Data tab shows the columns selected in the Features dropdown.
Further, the Result page is as follows.
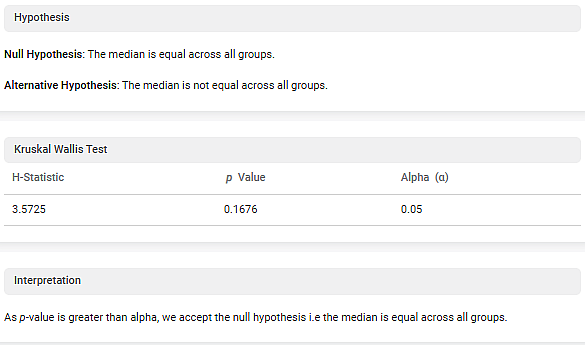
The result page consists of the following sections:
- Hypothesis
This section displays Null Hypothesis and Alternative Hypothesis defined by the system.
2.Kruskal Wallis Test
This section displays the Kruskal Wallis test result. It shows a value of the following parameters:
- H-Statistic
- p Value
- Alpha (α)
3.Interpretation
- Since the p value is greater than the alpha value; hence the null hypothesis is accepted. Accepting the null hypothesis means the medians are equal across all groups.
- You can conclude your study by stating that all independent drugs – Drug A, Drug B, or Drug C come from the same distribution.
- The effectiveness of all the drugs – Drug A, Drug B, or Drug C treatments are the same.
Related Articles
Two Sample Z Test
Two Sample Z Test Description Two sample Z test is a statistical test used to determine whether there is a significant difference between the means of two independent variables. Why to use To compare the means of two independent variables When to use ...Train Test Split
Train Test Split is located under Model Studio () under Sampling in Data Preparation, in the left task pane . Use the drag-and-drop method to use the algorithm in the canvas. Click the algorithm to view and select different properties for analysis. ...Train Test Split
Train Test Split is located under Model Studio ( ) under Sampling in Data Preparation, in the left task pane . Use the drag-and-drop method to use the algorithm in the canvas. Click the algorithm to view and select different properties for analysis. ...Train Test Split
Train Test Split is located under Forecasting ( ) in Data Preparation, in the left task pane. Use the drag-and-drop method to use the algorithm in the canvas. Click the algorithm to view and select different properties for analysis. Refer to ...One Sample Z Test
One sample Z Test is located under Model Studio > Statistical Analysis > One Sample z-test on the left task pane. Use the drag-and-drop method (or double-click on the node) to use the algorithm in the canvas. Click the algorithm to view and select ...