Lasso Regression
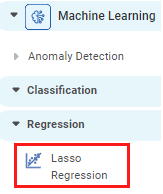
Lasso Regression is located under Machine Learning ( ) in Regression, in the left task pane. Use the drag-and-drop method to use the algorithm in the canvas. Click the algorithm to view and select different properties for analysis.
Properties of Lasso Regression
The available properties of Lasso Regression are as shown in the figure given below.
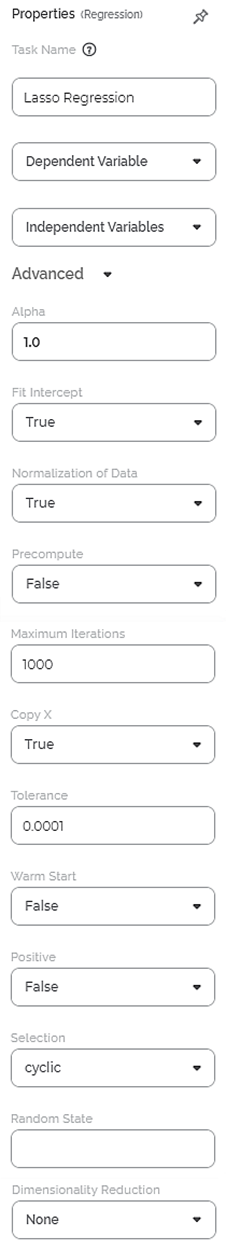
The table given below describes the different fields present on the properties of Lasso Regression.
Field | Description | Remark | |
| Run | It allows you to run the node. | - | |
| Explore | It allows you to explore the successfully executed node. | - | |
| Vertical Ellipses | The available options are
| - | |
Task Name | It is the name of the task selected on the workbook canvas. | You can click the text field to edit or modify the name of the task as required. | |
Dependent Variable | It allows you to select the dependent variable. | You can select only one variable, and it should be of numeric type. | |
Independent Variables | It allows you to select Independent variables. |
| |
Advanced | Alpha | It allows you to enter a constant that multiplies the L1 term. | The default value is 1.0. |
Fit Intercept | It allows you to select whether to calculate the value of constant (c) for your model. |
| |
Normalization of Data | It allows you to select whether the regressors will be normalized or not. |
| |
Precompute | It allows you to select whether to use a precomputed Gram matrix. | The values are True and False. | |
Maximum Iterations | It allows you to select the maximum number of iterations. | The default value is 1000. | |
Copy X | It allows you to select whether the feature input data is to be copied or overwritten. |
| |
Tolerance | It allows you to select the tolerance for the optimization. | The default value is 0.0001. | |
Warm Start | It allows you to select whether to reuse the solution of the previous call to fit as initialization. | The values are True and False. | |
Positive | It allows you to select whether the coefficients should be positive or not. |
| |
Selection | It allows you to determine a coefficient selection strategy. |
| |
Random State | It allows you to enter the seed of the random number generator. | This value is used only when Selection is set to random. | |
Dimensionality Reduction | It allows you to select the Dimensionality reduction method. | The options are None and PCA. | |
Example of Lasso Regression
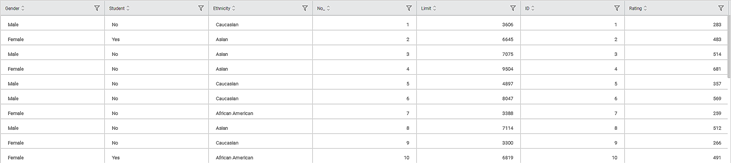
Consider a dataset of Credit Card balances of people of different gender, age, education, and so on. A snippet of input data is shown in the figure given below.
We select Education, Age, and Rating as the independent variables and Income as the dependent variable. The result of the Lasso Regression is displayed in the figure below.
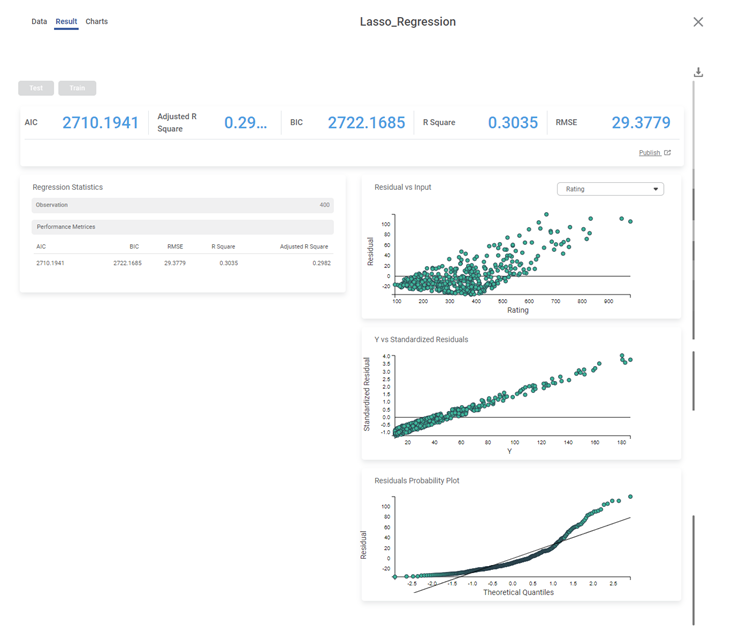
The table below describes the various performance metrics on the result page.
Performance Metric | Description | Remark |
|---|---|---|
RMSE (Root Mean Squared Error) | It is the square root of the averaged squared difference between the actual values and the predicted values. | It is the most commonly used performance metric of the model. |
R Square | It is the statistical measure that determines the proportion of variance in the dependent variable that is explained by the independent variables. | Value is always between 0 and 1. |
Adjusted R Square | It is an improvement of R Square. It adjusts for the increasing predictors and only shows improvement if there is a real improvement. | Adjusted R Square is always lower than R Square. |
AIC (Akaike Information Criterion) | AIC is an estimator of errors in predicted values and signifies the quality of the model for a given dataset. | A model with the least AIC is preferred. |
BIC | BIC is a criterion for model selection amongst a finite set of models. | A model with the least BIC is preferred. |
| MSE (Mean Squared Error) | It is the averaged squared difference between the actual values and the predicted values. | A model with low MSE is preferred. |
| MAE (Mean Absolute Error) | It the absolute value of difference between actual and predicted values | A model with low MAE is preferred. |
| MAPE ( Mean Absolute Percentage Error) | it is the average magnitude of error produced by a model, or how far off predictions are on average. | A model with low MAPE is preferred |
Related Articles
Support Vector Machine in Regression
The location of the Support Vector Machine is under Machine Learning in Regression on the feature studio. Alternatively, use the search bar to find Support Vector Machine (SVM) algorithm. Use the drag-and-drop method or double-click to use the ...Coefficient Summary
Overview Rubiscape now provides Coefficient Summary support for Ridge, Lasso, and Poisson regression, extending the existing functionality available for Linear and Polynomial Regression. This ensures all supported regression models display their ...Poisson Regression
Poisson Regression is located under Machine Learning () under Regression, in the left task pane. Use the drag-and-drop method to use the algorithm in the canvas. Click the algorithm to view and select different properties for analysis. Refer to ...Linear Regression
Linear Regression is located under Machine Learning ( ) in Regression, in the task pane on the left. Use the drag-and-drop method to use the algorithm in the canvas. Click the algorithm to view and select different properties for analysis. Refer to ...Polynomial Regression
Polynomial Regression is located under Machine Learning () under Regression, in the left task pane. Use the drag-and-drop method to use the algorithm in the canvas. Click the algorithm to view and select different properties for analysis. Refer to ...