Layout
When you plot a widget, the widget appears on the dashboard canvas within a page with default dimensions. The width and height of the page within the boundaries of the dashboard canvas define the Page Type.
You can view the Page Type under Page Size on the widget formatting pane.
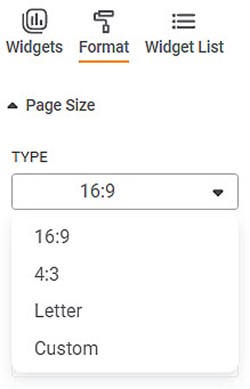
The table below describes the available Page Type options and their dimensions.
Page Type | Width (Max.) | Height (Max.) | Remark |
16:9 | 1280 | 700 |
|
4:3 | 960 | 720 |
|
Letter | 816 | 1030 |
|
Custom | 1284 | 700 |
|
When you plot a widget, its layout defines its width and height. The widget layout is smaller (in size) than that of the Page Type on which it is plotted.
You can change the widget layout using the Layout option available under Chart formatting options.
Note: | Layout option is available in all widgets. |
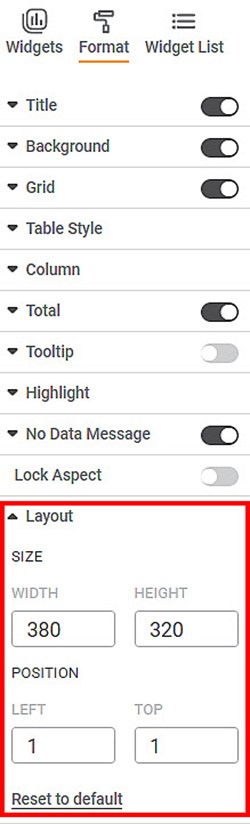
The table given below describes different fields present on Layout formatting.
Field | Description | Remark |
Width | It allows you to change the width of the widget. |
|
Height | It allows you to change the height of the widget. |
|
Left | It allows you to change the distance of the widget from the left margin of the page. |
|
Top | It allows you to change the distance of the widget from the top margin of the page. |
|
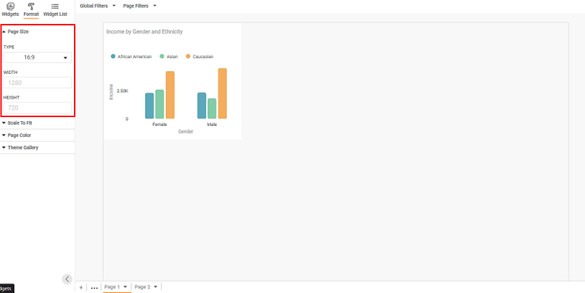
To use Layout formatting options, first plot any chart using the measures from the dataset.
In the figure below, we plot a Column Chart on a 16:9 Page Type.
Now, when you click the widget, the Chart menu is enabled.
Under Layout, you can see the default width and height values of the widget. You can also see its default distance from the left and top margins.
The figure below shows the default layout of the Chart.
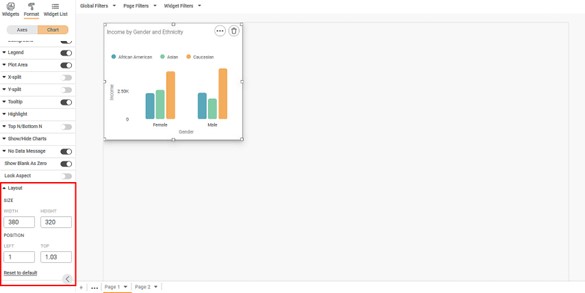
In the figure,
- The default position of the widget is near the top-left corner of the canvas.
- The default width and height are 380 and 320, respectively.
- The default distance from the left and top margins are 1 and 1.01, respectively.
Now, change the layout size and position.
- The Width and Height are 500 and 500, respectively.
- The Left and Top positions are 30 and 50, respectively.
Notes: | For a widget plotted on 16:9 Type of dashboard page,
|
The resultant widget is shown below.
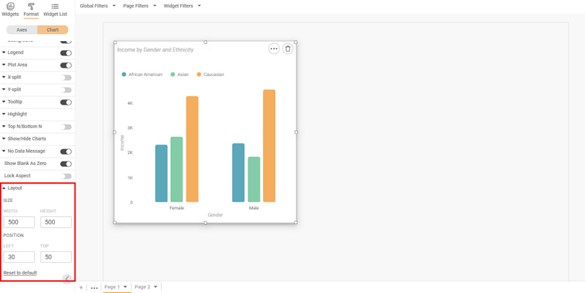
Since the sums mentioned above are within limits, the widget resizes to the newly selected dimension.
However, if the sums exceed the defined limits, the corresponding field is highlighted (red).
If you hover over the field, an error message “Value exceeds maximum limit” is displayed.
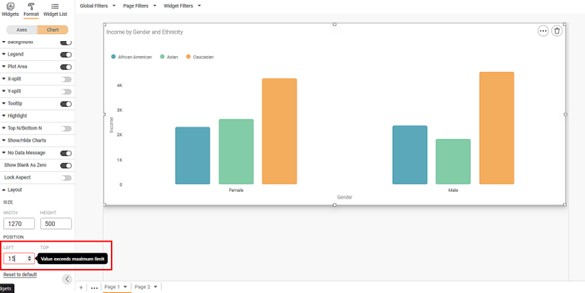
In the above example,
- The widget width is 1270.
- The distance of the widget from the left margin is changed to 15.
However, the sum 1270 + 15 is 1285, which is greater than the width limit (of 1280) of 16:9 Type of dashboard page. Hence, the Left field is highlighted, and an error message is displayed.
Notes: |
|
Related Articles
Layout
Layout refers to the dimensions of that portion of the canvas on which the Chart is plotted. These dimensions can be changed and adjusted as required. Here, the canvas size remains the same. The Layout formatting option is available in the Chart ...Stepped Layout
In RubiSight, you can plot a Cross Table using multiple features from the dataset. A Cross Table contains the following configuration options. Rows Columns Values The Stepped Layout option is available under Row in Cross Table formatting options. ...Introduction to Mobile View
Refer Navigate Mobile View to access the Mobile View. To ensure your dashboard is displayed correctly in the RubiSight Mobile Application, you need to configure the Mobile View. Charts can be organized in any desired layout, independent of the layout ...Configuring Dashboard from Mobile View
Refer Navigate Mobile View to access the Mobile View. Refer Mobile View introduction for getting details of the sections available in the Mobile View and why this configuration is required. Navigate to Mobile View of canvas for configuring dashboard ...Formatting a Table
This formatting applies to widgets that contain tables. For example, table formatting is possible for widgets such as Table and Cross Table. To format the chart, follow the steps given below. Create the number of charts as required. Refer to Creating ...