LSTM
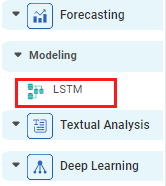
LSTM is located under Forecasting in Modeling, in the task pane on the left. Use drag-and-drop method to use algorithm in the canvas. Click the algorithm to view and select different properties for analysis.
Refer to Properties of LSTM.

Properties of LSTM
The available properties of LSTM are as shown in the figure given below.
The table given below describes the different fields present on the properties of LSTM.
| Field | Description | Remark | |
|---|---|---|---|
| Run | It allows you to run the node. | - | |
| Explore | It allows you to explore the successfully executed node. | - | |
| Vertical Ellipses | The available options are
| - | |
| Task Name | It displays the name of the selected task. | You can click the text field to edit or modify the name of the task as required. | |
| Time Id Variable | It allows you to select the variable from the drop-down list for which we need to predict the values of the dependent variable. |
| |
| Target Variables | It allows you to select the experimental or predictor variable(s). |
| |
| Group by | It allows you group the values by a column |
| |
Advanced | Time Steps | It provides feedback from the predicted value going back and forth. | It should be selected as per the data. If the target variables are more than one, time steps can be selected more. |
Dimensions Of Sequence Of Networks | Number of neurons to be used in the model to learn complex pattern from the data. | — | |
| Loss Function |
| There are two types of loss functions:
| |
| Optimizer |
| Adam optimizer is an optimization algorithm that can be used instead of the Classification stochastic gradient descent procedure to update network weights iterative based on training data. | |
| Activation Function |
| The two values are –
| |
| Batch Size |
|
| |
Related Articles
Components in Forecasting
Forecasting deals with the analysis and detection of trends in the time-series data. The components of forecasting are, Data Exploration: Data Exploration is used to explore the time-series data. It helps in identifying the underlying parameters ...