Naive Bayes
Naïve Bayes is located under Textual Analysis (  ) in Classification, in the left task pane. Use the drag-and-drop method to use the algorithm in the canvas. Click the algorithm to view and select different properties for analysis.
Refer to Properties of Properties of Naïve Bayes.
Properties of Naïve Bayes
The available properties of Naïve Bayes are as shown in the figure given below.
The table given below describes the different fields present on the properties of Naïve Bayes.
Field | Description | Remark | |
| Run | It allows you to run the node. | - | |
| Explore | It allows you to explore the successfully executed node. | - | |
| Vertical Ellipses | The available options are
| - | |
Task Name | It is the name of the task selected on the workbook canvas. | You can click the text field to edit or modify the task's name as required. | |
Dependent Variable | It allows you to select the dependent variable. |
| |
Text | It allows you to select independent variables. |
| |
Advanced | Add result as a variable | It allows you to select any of the result parameters as the variable. | You can select from the following performance parameters of SVM:
|
Node Configuration | It allows you to select the instance of the AWS server to provide control on the execution of a task in a workbook or workflow. | For more details, refer to Worker Node Configuration. | |
Example of Naïve Bayes
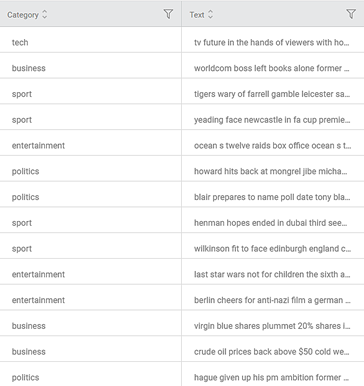
Consider a dataset containing BBC news snippets classified into different categories like tech, business, sport, politics, and so on. A snippet of input data is shown in the figure given below.
We select the following properties and apply Adaboost.
Dependent Variable | Category |
Text | Text |
After using the Naïve Bayes, the following results are displayed. On the result page, you can see the following output parameters
- Accuracy, F-score, Precision, Sensitivity, and Specificity are the model performance indicators displayed on the Results page.
- The Accuracy of the above Naïve Bayes model is 0.9895, F-score, Precision, and Sensitivity are zero (0) each, and Specificity is 0.7544.
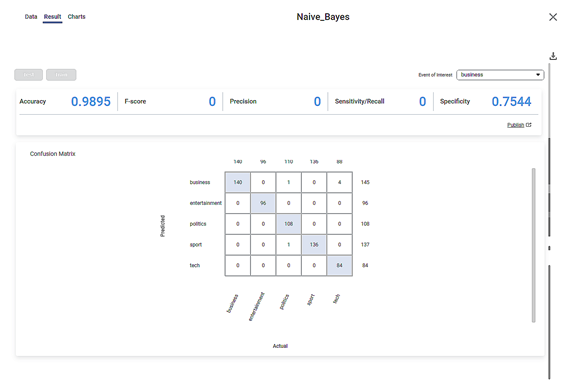
On the same result page, you see the confusion matrix containing predicted and actual values for Category.
- The shaded diagonal cells show the correctly predicted categories. For example, all 140 pieces of news in the business category are correctly predicted.
- The remaining cells indicate the wrongly predicted categories. For example, four (4) news in the tech category is wrongly predicted as belonging to the business
The figure below shows the resultant dataset in the Data tab.
- Along with the Index and Text columns, you can see the Category column showing the original categories.
- The predicted categories for each text are listed under the Label
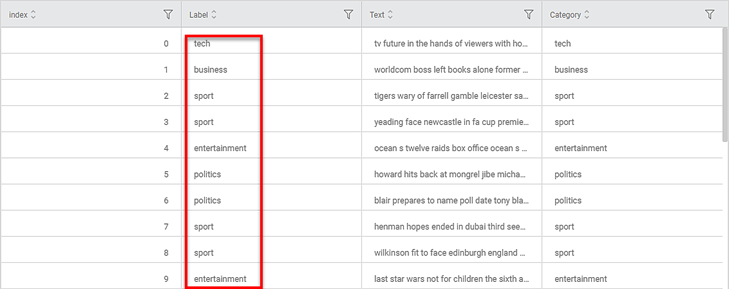
- You can compare Label and Category columns to check correctly and wrongly predicted categories.
Related Articles
Categorical Naive Bayes
The categorical Naive Bayes test is located under Machine Learning ( ) in Classification, on the left task pane. Alternatively, use the search bar for finding the Categorical Naive Bayes test feature. Use the drag-and-drop method or double-click to ...Classification
Notes: The Reader (Dataset) should be connected to the algorithm. Missing values should not be present in any rows or columns of the reader. To find out missing values in a data, use Descriptive Statistics. Refer to Descriptive Statistics. If missing ...