One Way ANOVA
 ) in ANOVA Analysis under Statistical Analysis, in the task pane on the left. Use the drag-and-drop method to use the algorithm in the canvas. Click the algorithm to view and select different properties for analysis. Refer to Properties of One-Way ANOVA.
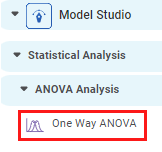
Properties of One-Way ANOVA
The available properties of One-Way ANOVA are as shown in the figure given below.
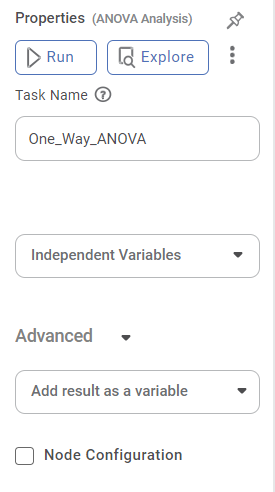
The table given below describes the different fields present on the properties of One-Way ANOVA.
Field | Description | Remark |
| Run | It allows you to run the node. | - |
| Explore | It allows you to explore the successfully executed node. | - |
| Vertical Ellipses | The available options are
| - |
Task Name | It is the name of the task selected on the workbook canvas. | You can click the text field to edit or modify the name of the task as required. |
Independent Variables | It allows you to select the experimental or predictor variable(s). |
|
Interpretation of Result of One-Way ANOVA
The table given below describes the parameters of One-Way ANOVA Test Results.
Parameter | Description | Remark |
Degrees of Freedom | The number of independent values that can differ freely within the constraints imposed on them. | — |
Sum of Squares | It is the sum of the square of the variations. Variation is the difference (or spread) of each value from the mean. | — |
Mean Sum of Squares | It is the value obtained by diving the Sum of Squares by Degrees of Freedom. | — |
F-Ratio | It is the ratio of two Mean Square values. | If the null hypothesis is true, the value of the F-ratio is closer to 1.0 |
p Value | It is the probability of obtaining the observed results, or more extreme, of a hypothesis test, assuming that the null hypothesis of the study question is true. | If p value < 0.05, we accept the alternative hypothesis. If p value > 0.05, we do not reject the null hypothesis. |
W Stats | It tests whether a random sample comes from a normal distribution. Shapiro Wilk Test and Bartlett Test both generate this value. | If the W Stats value is small, the null hypothesis is rejected, and it can be concluded that the random sample is not normally distributed. |
Shapiro Wilk Test | Null Hypothesis – The collected samples are from a normally distributed population. Alternative Hypothesis – The collected samples are from a population that is not normally distributed. | If p value < 0.05, we accept the alternative hypothesis. If p value > 0.05, we do not reject the null hypothesis. |
Bartlett Test | Null Hypothesis – All the samples have the same variance. (They have homogeneity in variance.) Alternative Hypothesis – All the samples do not have the same variance. | If p value < 0.05, we accept the alternative hypothesis. If p value > 0.05, we do not reject the null hypothesis. |
Example of One-Way Anova
Consider an example of a manufacturing plant that uses different packaging methods. The number of products packed per minute by five different methods - A, B, C, D, and E, is given below.
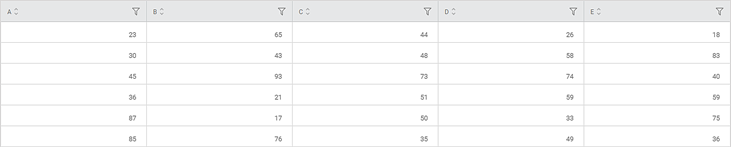
We apply One-Way ANOVA on the above data. The result is displayed in the figure given below.
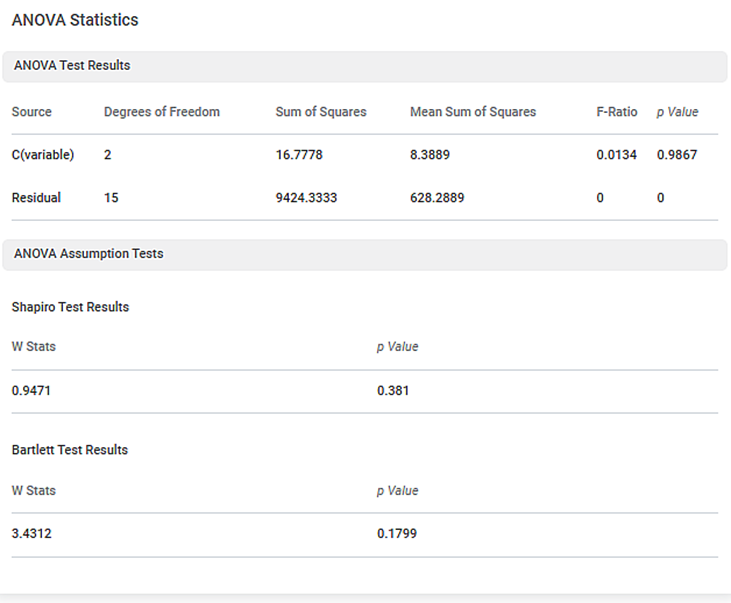
In the above figure,
- The p-value for ANOVA Analysis is 0.9867
- The p-value for Shapiro Wilk Test is 0.381
- The p-value for the Bartlett test is 0.1799
Since p-value of ANOVA (0.9867) is greater than 0.05, we conclude that the population is normally distributed, and all the samples have the same variance.
Related Articles
Two Way ANOVA
Two Way ANOVA is located under Model Studio ( ) in ANOVA Analysis under Statistical Analysis, in the task pane on the left. Use the drag-and-drop method to use the algorithm in the canvas. Click the algorithm to view and select different properties ...One Sample Wilcoxon Signed Rank Test
One Sample Wilcoxon Signed Rank Test is located under Model Studio () in Statistical Analysis below Hypothesis Test, under Non-Parametric Test in the left task pane. Use the drag-and-drop method or double-click to use the algorithm in the canvas. ...One Sample Z Test
One sample Z Test is located under Model Studio > Statistical Analysis > One Sample z-test on the left task pane. Use the drag-and-drop method (or double-click on the node) to use the algorithm in the canvas. Click the algorithm to view and select ...One Sample T Test
One Sample t Test is located under Model Studio > Statistical Analysis > One sample t Test. Use the drag-and-drop method (or double-click on the node) to use the algorithm in the canvas. Then, Click the algorithm to view and select different ...One Class SVM
One Class SVM is located under Machine Learning ( ) in Anomaly Detection, in the left task pane. Use the drag-and-drop method to use the algorithm in the canvas. Click the algorithm to view and select different properties for analysis. Refer to ...