Page Filter
The Page Filter option is always available on the filter pane of the Dashboard canvas. The page filters apply to all the charts plotted on a page of the Dashboard.
To apply a Page Filter, follow the steps given below.
Create the number of charts as required. Refer to Creating Charts using Widgets.
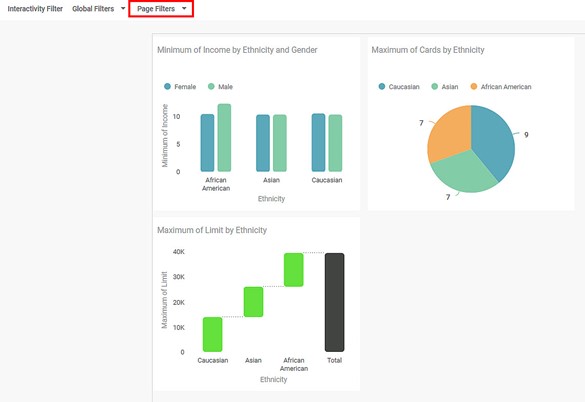
For example, here, we have created three charts on a page of the Dashboard canvas. All the charts contain the dimension Ethnicity in them. The three field values in the dimension are Caucasian, African American, and Asian.In the top filter pane of the Dashboard canvas, click Page Filters.
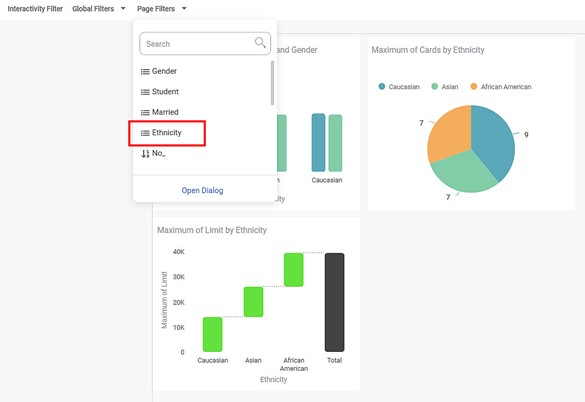
From the list of data fields, click the data field you want to use as a filter.
Here we are filtering by Ethnicity.
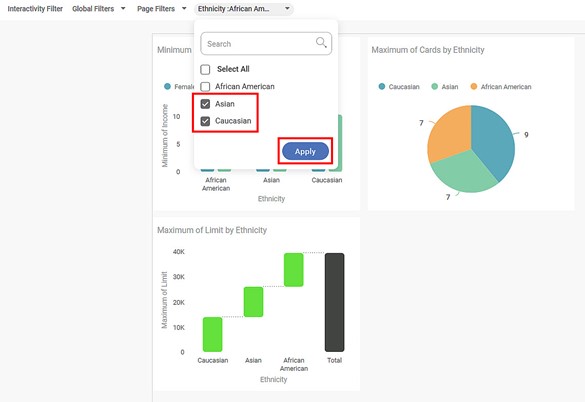
The Ethnicity field is added.Click the added Ethnicity field and select the checkboxes corresponding to the data field values you want to filter.
Click Apply.
For example, for the charts above, we have selected Asian and Caucasian.
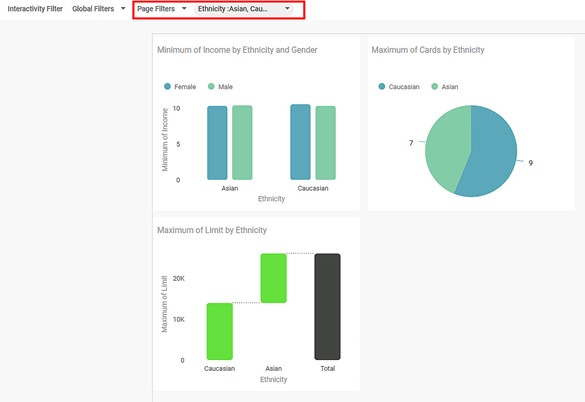
The filter is applied to all three charts, and the charts are filtered according to the selected data field values.
Notes: |
|
Page Filter - Further Options
If you apply Page Filter to a Dashboard page and copy a widget on that page to a new page, the effect of the newly applied filter applied is different according to the following possibilities.
If you apply a Page Filter on a new page and then copy a filtered widget to this page, new filters get applied to the widget (irrespective of the originally applied filters).
For example, plot a Column Chart of Sales by Category on Page 1.
Order Priority is selected as the Legend dimension. The four order priorities are Critical, High, Low, and Medium.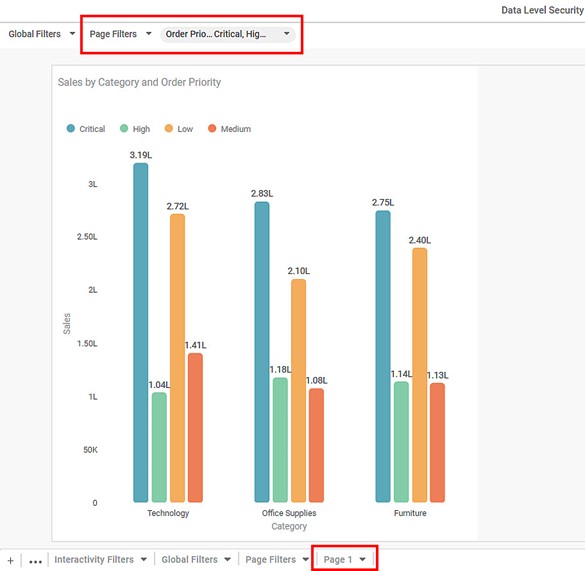
Apply Page Filter by retaining Critical and High while removing L and M.
The resultant filtered widget is shown below.
Now, add Page 2. Select and apply a Page Filter to the same feature Order Priority. In the example, Low and Medium are selected, while Critical and High are removed.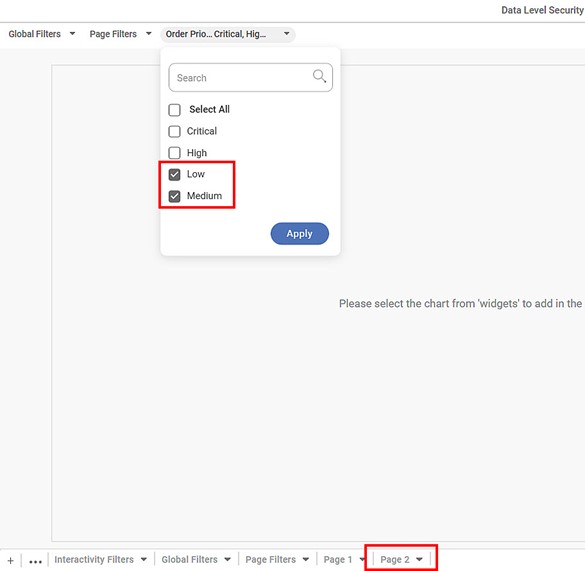
Next, navigate back to Page 1 and copy the widget to Page 2.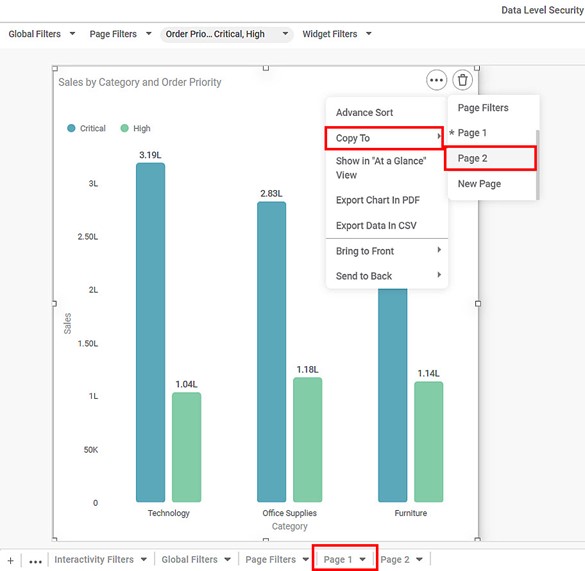
You see that the widget contains the Page Filter selected for Page 2, and the original filters from Page 1 are discarded.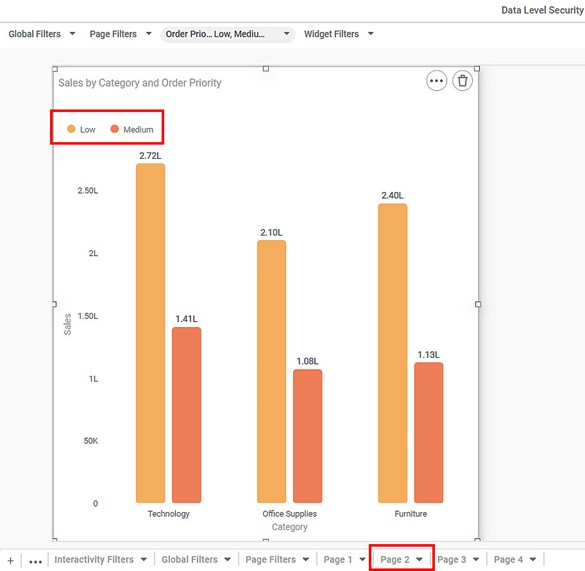
Similarly, on the new page, we apply a filter by selecting only H and discarding C. The new widget contains data for H alone.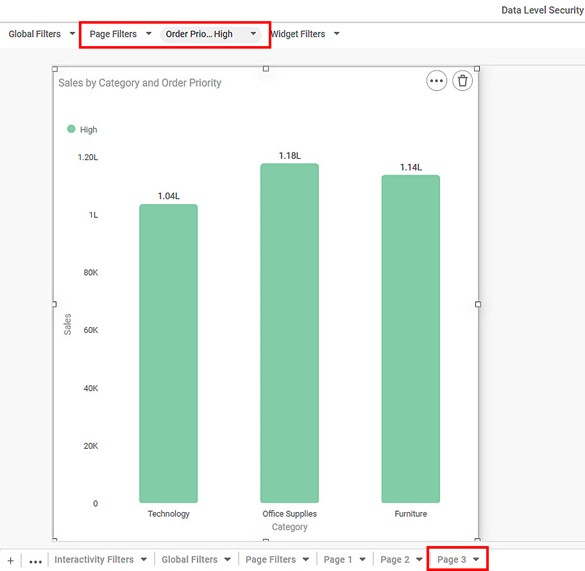
If you copy a filtered widget to a new page, it gets copied along with the filters.
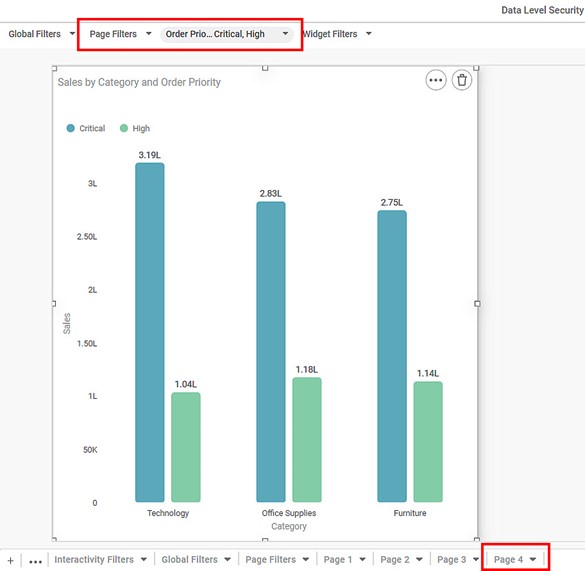
For example, we copy the filtered Column Chart to a New Page. In this case, a new page is added, and the widget is copied.
On the Page 4, you see that the widget contains the original Page Filter applied from Page 1.
Related Articles
Drill Through from Chart to Page with Context Filtering
Drill Through Filters (Page Level) Overview Drill Through Filter option is available at the page level in the Filter Pane and is accessible from Edit/View/Outer modes. It enables navigation from one widget to another page while passing contextual ...Drill Through with Keep All Filters
Drill Through with Keep All Filters This option is available from Rubisight dashboard edit mode. This option is available in page format settings. This is used to carry forward all applicable filters on the respective chart which is drilled through. ...Removing the Applied Filter
You can delete or clear the applied filter if it is no longer required. To remove the filter, use any of the following methods: Delete the applied condition. For this, navigate to the filtering dialog box, click the Delete icon, and then click Apply. ...Applying Filter to a Feature
To filter a feature in a dataset, follow the steps given below: Perform steps 1 to 4 of Exploring a Dataset. The explored dataset is displayed on the Data page. Click the filter icon () next to the Feature that you want to filter. A filtering dialog ...Search Option In Filter Widget
In RubiSight, a Filter Widget filters data present in other widgets on the same dashboard page. Usually, a categorical feature is used to plot a filter widget. When you plot a filter widget, the values appear on the filter widget in the form of List ...